Millage at the Village: Ward 2 Transit Talk
Voters in Ann Arbor, Ypsilanti and Ypsilanti Township will decide on May 6, 2014 whether they want to pay an additional 0.7 mill tax for five years – to fund increased public transportation service.
Exactly one week before the vote, Ward 2 Ann Arbor city councilmembers Jane Lumm and Sally Petersen hosted a resident meeting on the topic.
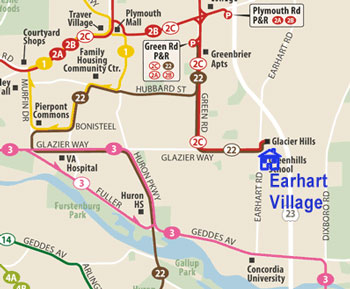
This AAATA route map shows the current configuration of fixed-route buses. Label and icon for Earhart Village added by The Chronicle.
Invited were all residents of Ward 2, city residents at large, as well as representatives of the Ann Arbor Area Transportation Authority. The AAATA board voted in February to place the millage on the May 6 ballot.
About 50 people attended. Among others, the meeting drew Ward 2 city council candidate Nancy Kaplan, former Ward 1 council candidate Jeff Hayner, former mayor Ingrid Sheldon, Ward 3 council candidate Julie Grand, and state rep Jeff Irwin (D-53).
This is a report of that meeting.
Lumm and Petersen had previously co-hosted a half dozen similar meetings for their constituents on a variety of topics. The April 29 event had a potentially broader impact: At a candidate forum held on April 16, 2014, mayoral hopeful Petersen had stated that she was planning to wait until after the April 29 ward meeting to decide on a possible endorsement of the millage.
At that time, Petersen was still a little bit on the fence – but leaning toward supporting it. By then, the three other candidates in the Democratic mayoral primary – Sabra Briere, Christopher Taylor and Stephen Kunselman – had already indicated support for the additional tax.
The April 29 evening meeting was held at Earhart Village – a 174-unit condominium community just off the north-south Earhart Road, between Plymouth and Geddes. The Route #2 bus line runs from downtown to the northeast up Plymouth – with a relatively infrequent variant, Route #2C, that offers service down from Plymouth to the Earhart Village area. Accessing Route #3 to the south, on Geddes, would mean about a 1-mile walk up Earhart for an Earhart Village resident.
Frequency of service to the Earhart Village area was among the complaints of some attendees. Many in the room were negatively inclined toward the millage, as one woman announced she’d already voted no, using an absentee ballot. But there were some voices in the room that backed the proposal. Responding to criticism that the AAATA was not a “lean-and-mean” organization, a teacher in the audience made a comparison to cuts by the school district: “Lean-and-mean is not serving our students.”
AAATA staff Chris White, Michael Benham, and Mary Stasiak gave a presentation to the group before fielding questions. Lumm and Petersen structured the interaction by reading questions that attendees had written on index cards, but people were also free to ask direct questions. Some questions were pointedly critical in tone: “Does the millage money cover the additional wear and tear on the roads due to the additional buses?” And some were softballs: “Do Ward 2 constituents understand the benefit of bus expansion for low-income people and people with disabilities?”
At the conclusion of the meeting, Petersen quipped: “We had loaded questions, we had loaded answers. Hopefully one way or another we’ll have loaded buses sometime soon!” And Petersen announced her support for the millage two days later at a May 1 morning meeting of the Main Street Area Association.
However loaded the questions might have been, they elicited some useful information about how public transportation works. This report is organized along three broad themes reflected in the questions and comments from residents: overall efficiency of the AAATA as an organization; the nature of transportation funding; and some basics of public transportation service. The report is supplemented with charts generated from a national transit database.
AAATA Efficiency
A number of questions from the audience – either written on cards and handed to Lumm and Petersen or asked directly – dealt with a perception that the AAATA is not operationally efficient.
AAATA Efficiency: Staffing
Question: If the millage passes, how many new jobs will be created in total at the AAATA, and how many of those will be new drivers? [Background to the question is a claim by opponents of the millage that the AAATA has 52 management staff.]
CHRIS WHITE: We expect over the five-year period about 60 new drivers. And there will be a couple of mechanics because we’ll have a larger fleet of buses. There might be a supervisor or two related to mechanics or facilities – but so far it looks like we can handle this with the staff we’ve got.
Question: Cutting administrative staff could offset increased costs – why isn’t that being pursued?
CHRIS WHITE: Right. That assumes that those administrative staff are not being productive and are not doing tasks that are worthwhile. That’s a judgment for the AAATA board to look at and see what our plans are and what we need to do to carry that out. Administrative staff includes our mechanics supervisors, the transportation supervisors, the people who are dispatching buses, the people investigating accidents, human resources, finance, IT, planning, the people who sell tickets, the people at the front desk, at the Blake Transit Center – it’s a wide range. Our judgment is that the staff that is there is needed in order to provide the level of service that we provide.
MICHAEL BENHAM: There are a number of folks at the office who were amazed to learn that they were “managers.” We have 11 managers. There are 52 non-union employees. That’s a big difference. There’s some messages out there that are a little bit misleading. Take our IT staff – they’re working on the overhead signs on the buses, they work to maintain those, they maintain the fare boxes. The system is very electronic these days. So our IT staff is part of those so-called “managers,” but without them we would not know where our buses are, we would not be able to provide messages to people as the bus arrives at the stop.
[Later in the meeting, Benham stressed the importance of IT staff in some of the shorter-term research and development initiatives.]
The other thing I think we should point out in terms of research and development, some of it is looking fairly far down the road. But some of it is looking at short-range issues. One of those is transit signal priority, where buses can communicate with the traffic signals and a little extra green time or gain a little extra time on that left turn – and that will speed up our operations quite a bit. With more traffic out there, we are concerned that our operations might slow down and we want to make sure that we can keep up with it.
Also, fare box technology is another big thing. Right now, if you ride our service, you see people get on the bus and people unroll their dollar bill and it takes a while at each stop. Obviously you want to collect those dollars, but it slows down our operation to do that. There are technologies out there that are being used by other systems, where you buy your ticket on your phone and you show it to your driver or you have a smart card that you don’t have to put into the farebox, you can just bring it close to the farebox. Those technologies are here, but it takes work to figure out how to apply these technologies in the system. But that’s going to speed up service. We’re looking long-term, but we’re also looking at very near-term possibilities.
Question: Does the AAATA conduct salary surveys and keep its salary levels commensurate with the corporate world?
CHRIS WHITE: We have a salary administration program that we’ve had in place for a number of years. It compares our administrative wages by position with similar positions in southeast Michigan. We benchmark those positions that are relatively simple to compare: Manager of human resources is pretty much the same at a transit agency as it is at a lot of other places … finance manager and that kind of thing. And so those are benchmarked. We keep our salaries in line with those in southeast Michigan.
AAATA Efficiency: Expenditures on Marketing, Campaign
Question:What about all the marketing staff and consultants on marketing?
MICHAEL BENHAM: As far as marketing, we have 50% more riders per service hour than our peers. In part that is because of our marketing. That’s because we offer innovative programs. We go to schools and we talk with kids early on to see if we can introduce them to transit and make them lifelong transit riders. We go to the University of Michigan and we offer options to them for getting to their workplace without bringing their car into Ann Arbor. We go to companies and talk to them about how they can get downtown without bringing their car into the downtown, and on and on.
You know, transit is not necessarily something that people know about or think about. Some people do, but we need to work hard to get people onto the system. We have a big chunk of ridership that we call “transit dependent” – they don’t have cars and they don’t have any other choice. But the big and growing part of our system is what we call “choice riders.” Those are people who have a car, or maybe have one car at home and there are two wage earners. But they have a choice whether to take that bus to work, or to the theater, or what have you. Maybe they do it to save money – which they do – or maybe because they are environmentally conscious. So the marketing we do – we call it outreach – it is our way of talking to the community and getting people interested in the service and getting people onto the bus and making that productivity 50% higher than our peers. That’s what that’s all about.
RESIDENT A: You said that the marketing campaign is designed to go to schools to urge students to use the bus more. I’ve watched the campaign over the last two years, and much of it has nothing to do with urging people to ride the bus. “TheRide, your way, vote on Tuesday.” “TheRide gets people to jobs for a healthy economy. Vote May 6.” “TheRide is essential for independent living. Vote May 6.” It’s all feel-good stuff to make people feel good about the AAATA – and damn little of it is the kind of thing the Ann Arbor District Library has, which is: We have a program here and we have a program here – Ya’ll come.
MICHAEL BENHAM: The Ride Guide is something we publish three times a year that has all information about how to ride the bus, the different kinds of tickets that are available, how to use the Blake Transit Center – so this is a central book. This is our bread and butter.
RESIDENT A: I’ve lived here 45 years, and I’ve never seen a more expensive taxpayer-funded millage campaign than the one I’m experiencing right now.
RESIDENT B: You think there’s something wrong with the AAATA telling you that there is a millage vote going on?!
MARY STASIAK: It would be completely inappropriate for the agency not to tell people that there was a vote coming up. And it’s really important that we tell people that there is a vote so that they can have a choice and they can decide for themselves what it is and how they want to vote. And you learn about it. It’s our job to tell you that this is what would be included and what you would be paying for. If we did not do that, then I would say shame on us.
SALLY PETERSEN: The sentiment I’m hearing is that some of the informational literature – knowing that you’re not a campaign organization – it feels like it’s going right up on the edge of being campaign propaganda. You say to vote, but you don’t say how to vote.
RESIDENT C: If you say you want as many people to know about it as possible, why are you having it in May instead of voting when we’re voting for governor [in November]?
MARY STASIAK: We did that on purpose so that we would not be competing with all the other issues, so that people have a clear understanding of what they were voting on.
RESIDENT C: You’d have another three months to learn about it.
AAATA Efficiency: Overall Perception
Question: I just want to say that the city, the schools and all of us workers have had to become more lean-and-mean. And I have not seen that from this presentation. We feel like [the marketing campaign] is more grandiose spending of money. We want to see you be lean-and-mean like we’ve all had to – in our jobs and our schools, and our state government. We feel like you could be a little more lean-and-mean on things.
MICHAEL BENHAM: There’s two ways to succeed in business. One is to slash and cut – bring out the meat cleaver, slash costs to the bone to the point where it really hurts your product. The other way to do it is to do what we’ve been doing – which is to build up our customer base, build our customers so we have that 50% more than our peers. We are a lean-and-mean organization. We keep a constant eye on costs and we are always looking at ways to save a few dollars here and there. But by the same token, we pay attention to our customers, both our existing customers and the many people out there who would be our customers in the future. It’s really about how to succeed in business, and I think that’s what we’re doing.
RESIDENT D: Being a teacher, lean-and-mean is not serving our students.
AAATA Efficiency: Comparative National Stats
When Benham referred to the AAATA’s 50% greater ridership per service hour than its peer group, he was citing the result of a peer-group comparison analysis from a tool that is available through the Florida Transit Information System (FTIS) based on recommendations from the Transit Cooperative Research Program.
To determine a peer group, the tool relies on the following criteria to establish a “likeness” index between a transit agency and other transit agencies nationwide:
- urban area population
- total annual vehicle miles operated
- annual operating budget
- population density
- percent of college students
- population growth rate
- percent service purchased
- percent low-income population
- annual delay (hours) per traveler
- freeway lane miles (thousands) per capita
- percent service demand-responsive
- distance between agencies
Based on the “likeness” index, it’s possible to select the top 20 (or any number) of other transit agencies to analyze in comparison to the AAATA. Measured on the above criteria, using 2010 demographic survey information, the most similar 20 organizations to the AAATA are transit agencies in these peer communities: Peoria, IL; Lexington, KY; Moline, IL; Lansing, MI; Syracuse, NY; Savannah, GA; Champaign-Urbana, IL; Roanoke, VA; Concord, CA; Erie, PA; Kalamazoo, MI; Harrisburg, PA; Fort Wayne, IN; Rockford, IL; Shreveport, LA; Hartford, CT; Fort Collins, CO; Scranton, PA; Gainesville, FL; and South Bend, IN.
The peer group scoring based on the following year’s data resulted in a group of peers that overlapped in 19 out of 20 cases, with some minor shuffling of “likeness” scores.
Using the same tool, The Chronicle was able to replicate the AAATA’s conclusions in determining the peer group, as well as the comparative analysis for three metrics. For its fixed-route service, the AAATA’s cost per service hour is higher than its peer group average. But the AAATA’s number of riders per service hour is higher than its peer group. The number of riders per service hour is sufficiently higher that it pushes the AAATA’s cost per ride lower than its peer group.
In the charts below, the AAATA is always presented in the leftmost bar, and the other transit agencies are presented from left to right in their rank order of “likeness.” The peer group median is shown in a horizontal red line.
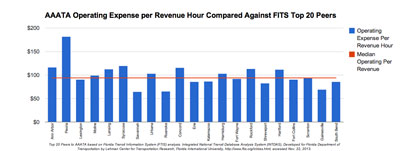
AAATA Operating Expense per Revenue Hour compared against FTIS Top 20 peers. Top 20 peers to AAATA are based on Florida Transit Information System (FTIS) analysis. Data from Integrated National Transit Database Analysis System (INTDAS), developed for Florida Department of Transportation by Lehman Center for Transportation Research, Florida International University, http://www.ftis.org/intdas.html, accessed Nov. 22, 2013.
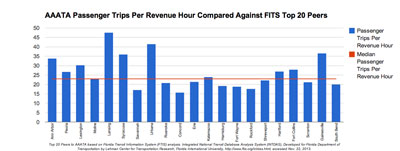
AAATA Passenger Trips per Revenue Hour compared against FTIS Top 20 peers. Top 20 peers to AAATA based on Florida Transit Information System (FTIS) analysis. Data from Integrated National Transit Database Analysis System (INTDAS), developed for Florida Department of Transportation by Lehman Center for Transportation Research, Florida International University, http://www.ftis.org/intdas.html, accessed Nov. 22, 2013.
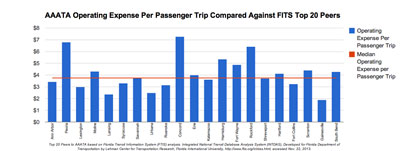
AAATA Operating Expense per Trip compared against FTIS Top 20 peers. Top 20 peers to AAATA based on Florida Transit Information System (FTIS) analysis. Data from Integrated National Transit Database Analysis System (INTDAS), developed for Florida Department of Transportation by Lehman Center for Transportation Research, Florida International University, http://www.ftis.org/intdas.html, accessed Nov. 22, 2013.
While there’s been considerable public back and forth between opponents of the millage and the AAATA about the number of managers employed at the authority, the National Transit Database includes administrative employees and total employees (as well as other categories of employees) as variables. For 2012, the database shows 26.5 FTE in administration and 181 total employees. If administrative FTEs are computed as a percent of the total and that statistic is compared to the AAATA’s peer group, the AAATA’s percentage is higher than the peer group median:
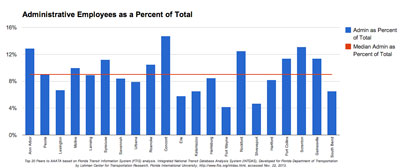
AAATA Administrative Employees as a Percentage compared against FTIS Top 20 peers. Top 20 peers to AAATA based on Florida Transit Information System (FTIS)
Historically, the number of administrative employees at the AAATA has trended higher over the last three years, as the organization has added capacity for planning and development of service expansion alternatives and public engagement. At the April 29 meeting, AAATA representatives indicated that if the millage passes, the service improvements would result in 60 additional bus driver positions, but not add administrative positions. That mix (shown in the red bar) would bring AAATA’s administrative staff ratio back in line with the percentage the AAATA has had historically:
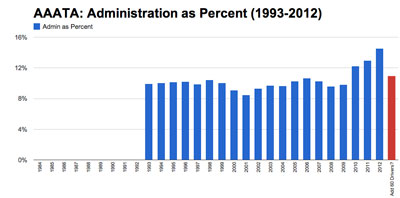
AAATA Historical Employees as a Percentage charted with data from the Florida Transit Information System (FTIS)
The AAATA’s higher ridership also means that the number of rides provided per employee is higher than its peer group:
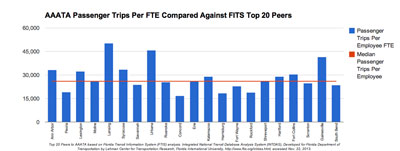
AAATA Trips per FTE compared against FTIS Top 20 peers. Top 20 peers to AAATA based on Florida Transit Information System (FTIS) analysis. Data from Integrated National Transit Database Analysis System (INTDAS), developed for Florida Department of Transportation by Lehman Center for Transportation Research, Florida International University, http://www.ftis.org/intdas.html, accessed Nov. 22, 2013.
Funding Sources for Public Transportation
In addition to questions about millage mechanics, several of the questions from residents touched on various funding sources and why they are not being used instead of a millage.
Funding Sources: AAATA Millage – We Already Pay
Question: The $70 that this millage would cost the owner of a $200,000 house is on top of the city millage of 2 mills that we are paying already – so you’re not just paying $70, you’re paying $270.
MICHAEL BENHAM: That’s a good point, and we have balanced the service with the revenues. While Ann Arbor is paying more for the service – because of these stacked millages – Ann Arbor is getting the overwhelming majority of the service. Ypsilanti is putting 0.7 mills on top of their roughly 1 mill and they’re getting that level of service.
Funding Sources: AAATA Millage – After Five Years?
Question: If this is a five-year plan, does this imply no request for an increased millage for the next five years?
MICHAEL BENHAM: We haven’t really looked that far, to be honest. There’s more need for service out there, there’s no question about it, but we have not made any plans to expand the system beyond five years. You have seen our 30-year plan. We need to be flexible in response to changes: A new employer coming into town, or a new large set of apartments can change a lot of our plans. As long as growth continues, I think it is safe to say there will be more services needed out there. We are aware already that our proposed services won’t serve all of the needs. But we are also aware that the public appetite for providing transit on every street is not there.
CHRIS WHITE: I think an important point of this is that we have tried to be careful in planning the funding so that the 0.7 mills is sufficient to fund the service plan in place. And at the end of that five-year period, that same millage rate would be sufficient to carry it forward. We are not going to wind up in a position at the end of five years where we say that we can’t continue the service after five years unless we get a higher millage. So we tried to be careful in planning. That has been the intention to make sure that 0.7 mills is sufficient pay the service now, and into the future after five years.
Question: If the millage passes – which is 35% more than what we’re paying now – and we’re not happy with it, can we vote it down or do we have it forever?
CHRIS WHITE: At the end of five years, this millage would come up for renewal. [Yes, it could be voted down.]
Funding Sources: RTA Millage?
By way of background, the southeast Michigan Regional Transit Authority was established in a lame duck session of the Michigan legislature in late 2012, and includes a four-county region – Macomb, Oakland, Washtenaw and Wayne – with each county making two appointments to the board, and the city of Detroit making one.
Question: What about concurrent millages? If the AAATA millage passes, and in 2016 when the regional transit authority (RTA) asks for one, is there any guarantee that there can’t be any concurrent millages that will be added on top of this?
CHRIS WHITE: It’s really hard to say what the RTA is going to do. They’ve been working really hard to get their act together. But it is going very slowly. If there’s anything from the RTA, it will be for the region and for regional service, not for local service within Washtenaw County. If there’s going to be regional service, that will be the RTA’s role and they would have to seek funding from that four-county region.
MICHAEL BENHAM: One of the things that we are concerned about is that the RTA is out there, but we don’t know when they are going to be able to take care of the needs that are out there. The needs are here today. At the earliest, it would be two years before they’re even prepared to request funding. We felt like the needs were pretty urgent.
Funding Sources: State, Federal
Question: How long are the matching funds that you are requesting supposed to last? Are you counting on those funds to remain in place in perpetuity?
CHRIS WHITE: It’s something we worry about a fair amount. It’s one of the reasons we have always had a reserve account – to try to make sure that something doesn’t happen. The state funding mechanism has been in place since 1974, and since that time the state has funded public transit pretty much the same way. Funding as a percentage of operations has been declining over a long period time – but at a very gradual rate, and we’ve been able to manage. The state provides a match for federal capital funds – and that is the first priority for funds that come from what is called the state’s Comprehensive Transportation Fund. So from the state, you have a long history but that doesn’t mean it can’t change.
RESIDENT E: So does the millage increase take that into account or not?
CHRIS WHITE: The budgeting for the millage increase includes a continuation of that state funding that has been in place for 30 years. The second part of it is federal funding – and we also count on federal funding. Similar to state funding, the basic formula for federal funding has been in place for 30 years. The difference with federal funding is that we have seen very steady increases in the level of funding. Part of that funding is based on the population of our urbanized area.
Part of it is based on the amount of service we provide and the amount of service that gets used. That funding has been increasing. We are not counting on further increases, but we are counting on the continuation of that funding source that has been in place for 30 years. So yes, that is something that we worry about in terms of what we could do in the future. But there’s also some pretty significant planning in place. Unlike most places, we don’t spend all of the federal money in the year that we receive it. The feds are nice, they give us money, and they actually let us plan how to use it. The money we get this year we can use over the next three years.
What we do is put together a five-year plan. We bank some of that money, partly for that eventuality that if something happens, we make sure that we can smooth out any change.
RESIDENT E: So you’re asking for more money than you really need?
CHRIS WHITE: No.
RESIDENT E: But if you have money in reserves, you are asking for more money than what you need for operating.
CHRIS WHITE: It is wise and prudent for any organization to have some level of reserves to make sure that they can weather unforeseen circumstances. With transit service, if something happens, we’re not going to just shut the doors. We’re going to be able to do a plan to change. But reserves are something we actually have to have.
MICHAEL BENHAM: Remember the federal shutdown. We need to be prepared if there is a temporary problem. If there is a longer-term problem, this is not entirely out of our control. We do work very closely with our congressional delegation, we work with our local delegation in Lansing, and with the other transit agencies to really push for these funding programs. It’s not that we’re sitting back waiting for something to happen. We work hard to influence those programs. Keep in mind that there are 450 other transit agencies in this country and we work together to push hard for that funding and we have been successful for 30 years.
Funding Sources: Purchase of Service Agreements (POSAs)
Question: What aren’t increases to POSAs being considered as a way to offset increasing costs?
MICHAEL BENHAM: POSAs cost what the service is worth – what it costs the AAATA. If we increase the cost of the POSA, that would not be fair: We would be getting more for the service than what it costs us. We take the number of service hours we are providing and multiply that by the fully-allocated cost for service – that’s the cost. Then we give the POSA community credit for: (1) the fares that are collected; (2) the state share (the state provides 30% of the cost); and (3) the federal share – because some of that is earned for their operation for their riders. The difference between the cost and those three revenue sources is the amount that a POSA community is required to pay to get their service.
Funding Sources: Fares
Question: Why aren’t fare increases being pursued as an option for funding increased costs?
[In response to a different question, AAATA staff explained that $3.36 is the AAATA's cost per rider on the fixed-route system. The full cash fare is $1.50. The average fare paid by passengers is about $0.80. That lower average is due to a variety of factors: transfers are free; and discount fares are provided for seniors and people with disabilities, low-income people and students.]
CHRIS WHITE: We increased the fare 50% in the last five years. There was a 25% increase in 2010 and another 25% increase in 2011. [These two increases lifted the full cash fare from $1 to $1.50.] So that’s a substantial increase. That fare increase is passed through to everybody who pays fares, including the third-party fares that we get from a lot of organizations [such as the University of Michigan and go!pass program].
Funding Source: Fares from Third Parties
Question: Why does the University of Michigan pay only $1.25 million per year for 2.5 million rides. That’s $0.50 a ride.
[The key fact is that UM's reimbursement to the AAATA is made partly in cash, and partly through federal funds. The question assumes that the cash portion is the only reimbursement.]
MICHAEL BENHAM: The university reimburses us $1 for every single ride – we get reimbursed at a rate that’s slightly higher than the average fare.
CHRIS WHITE: For 2.4 million rides, the amount that we see from the university is about $1.2 million in cash. It’s a little complex. Part of the federal formula for determining funding allocations is based on riders, passenger miles, and vehicle miles. The University of Michigan provides a public transit service [through its blue bus system.] One of the things the AAATA did 15 years ago was convince the university to start filing a report with the feds – an actual transit database report – which brings in the federal funds for the University of Michigan’s bus operation.
The agreement we have with university for their faculty, staff, and students – which allows them to board AAATA buses without paying the fare to get on – turns over to us the federal funds that are earned by the University of Michigan bus system. We got $1.35 million in federal funds last year from that, and every year it’s going up. And if the ridership goes up, they will pay more. But for every university rider, we get a dollar.
It sounds like something is wrong there because the full cash fare is $1.50. But the AAATA board of directors looks at two things. First, university employees live in this community, and they pay taxes in this community, and they are entitled to public transit services as well. That’s one thing that gets lost. The second thing is that we do sell passes to anyone at a volume discount. You can buy a monthly pass and it costs $58. When people use those monthly passes, we count how many times they use it.
It works out on average to about 90-91 cents per boarding. We charge the University of Michigan $1 per boarding. So we’re actually charging them more – about 10% more – than the least expensive fare that anybody in the public can get. We don’t give away service to people. We have partnerships and we use them. One of the advantages is that it gives us the fare revenue and also gives us the productivity to allow us to look at expanding services. We feel pretty strongly that we have an obligation to provide comprehensive transit service to allow people who live in this community who do not drive – a lot of them choose not to drive. So having a public transit system is an important thing that we feel are required to try and do. The nice thing is that we can add ridership from some of these riders of choice, and that helps us to expand service that benefits the entire community.
Funding Sources: Fares – National Stats
The farebox recovery ratio is the percentage of costs covered by passenger fares. Using the same kind of peer group comparison as above, it’s possible to analyze AAATA’s farebox recovery ratio with its national peers. The AAATA has about the same farebox recovery ratio as the average of its peer group:
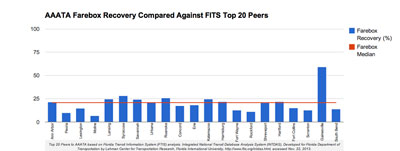
AAATA Farebox Recovery compared against FTIS Top 20 peers. Top 20 peers to AAATA based on Florida Transit Information System (FTIS) analysis. Data from Integrated National Transit Database Analysis System (INTDAS), developed for Florida Department of Transportation by Lehman Center for Transportation Research, Florida International University, http://www.ftis.org/intdas.html, accessed Nov. 22, 2013.
The AAATA’s farebox recovery ratio has trended upward in recent years, attributable to fare increases implemented in 2010 and 2011 ($0.25 both years for a total increase from $1 to $1.50).
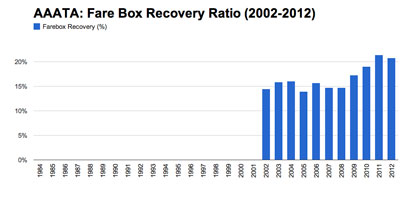
AAATA Farebox Recovery Historical Trend with data from Integrated National Transit Database Analysis System (INTDAS), developed for Florida Department of Transportation by Lehman Center for Transportation Research, Florida International University.
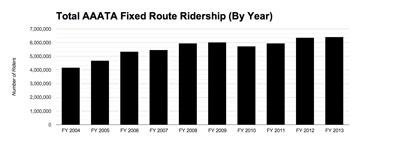
Farebox recovery is also influenced by ridership. All other things being equal, more riders means a higher farebox recovery ratio, because more riders generate more fares. Ridership on AAATA fixed-route buses has trended upward:
All other things being equal, increasing ridership also pushes the cost per ride downward:
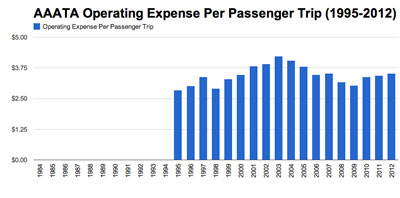
AAATA Farebox Operating Expense Per Passenger Trip with data from Integrated National Transit Database Analysis System (INTDAS), developed for Florida Department of Transportation by Lehman Center for Transportation Research, Florida International University.
Funding Sources: Restricted – BTC Construction
Question: The AAATA spent a great deal of money on a new transit center. Why? Why was that money not spent on moving people?
CHRIS WHITE: The money we spent on that was 80% federal funds and 20% state funds – that we received by making a competitive application for it. Those are federal funds that were brought into the community that would not otherwise have come, in order to improve that transit center. The old transit center was for a variety of reasons undersized and was 25 years old, so it was time for a new facility.
That new facility provides a much better waiting area for riders. But it also allows us to provide information to those riders so that they can see what buses have arrived. If you’re familiar with the arrangement we have downtown, we have a transit mall where we have six buses, and we have the east side of Fourth Avenue where we have eight buses. The farthest buses towards Liberty Street are out of sight, and it’s a little hard to see when the buses arrive. So part of the idea is to provide a new facility that allows us to provide electronic information, much as you would see at transit centers in other cities.
Funding Sources: Restricted – Planning
Question: I’ve heard that in the 2014 AAATA budget that there is a planning category that includes $2 million just for three things – WALLY [north-south commuter rail], the Connector [a high-capacity link from US-23 and Plymouth down through UM campus, downtown southward to State and I-94], and something called “urban core” planning. Now if this is true, why shouldn’t that $2 million be used for improving services rather than expanding into newfangled, improbable, grandiose schemes? You’re talking about service and the need for service for handicapped people, etc. In the budget apparently is WALLY – to subsidize people who live in Ann Arbor and work here to move to low-tax Livingston County so they can get the best of all worlds. Or the Connector, that largely benefits the university but won’t pay for it.
CHRIS WHITE: The budget figure is correct but your observation does not reflect the revenue sources that support it. The Connector is an initiative that came out of the city’s transportation plan. The AAATA is the lead agency for that, and we have a $1.2 million grant from the federal government for that specific purpose. So we made a competitive application and we got money for that. There’s another $300,000 that has to come from partners. The University of Michigan is paying half of that $300,000. The AAATA is paying $60,000 and the city and the Ann Arbor Downtown Development Authority are splitting the remainder. The amount the AAATA is paying is $60,000.
MICHAEL BENHAM: WALLY is a joint project with the state. The state got $650,000 to study WALLY and it is a research and development project. There’s also some local money, but it is not our money – those are contributions by other organizations within the county and from Livingston County to pay for the local match.
Transit Service
The evening led off with a presentation from AAATA staff describing the historical background of governance changes to the AAATA over the last year, and a description of the 5-year service plan the new millage is supposed to pay for. A number of questions dealt with operational aspects of specific types of service.
Transit Service: Description of Improvements: Fixed Route
Chris White gave a description of the fixed-route service improvements the millage would pay for.
CHRIS WHITE: One of the points I want to make up front is that the proposed millage is to fund additional service. We provide a pretty extensive suite of services now. Our fixed-route service, A-Ride (for people with disabilities), Good as Gold (for seniors) – those will continue regardless of what happens with the millage. The vote is to provide additional service.
There is a schedule book that we put together that we call the Ride Guide of the future that we brought to all the public meetings – specific schedules for all the routes that we are proposing, so that people could know what we’re proposing to do, so that you can give us input on and make comments on it, and we could go back and make revisions to that plan and respond to that. A number of revisions got made that way. Overall, what we’re proposing to do is about a 44% increase in our fixed-route service hours. There also increases in our A-Ride service – the service for people with disabilities and seniors.
The first element of that we would do in August 2014 – a few months from now, if the vote is successful – is to extend the end time of our service on weekdays on most of the routes. Most of the routes would go from 10:30 p.m. to 11:30 p.m. There are a couple of routes where we don’t have evening service on now that we would extend into the evening, and one of them is the route that serves this area – Route #2C that comes down Green and goes to Glacier Hills. Another one is the Route #14 route that serves Arbor Hills. Those routes would be extended to between 7:30 p.m. and 8 p.m.
The second element of the plan is later evening service on weekends. It’s one of the very specific requests we get – to have Saturday evening service. Service currently ends between 6 p.m. and 7 p.m. on most routes on Saturday. Service would be extended about an hour on all the routes in the first year if the millage passes, starting in August 2014. And then in August 2015, service would be extended essentially on all routes to between 10 p.m. and 11 p.m. on Saturdays.
That would also lead to an extension of our A-Ride and Good as Gold services. So if someone is out for a play, a concert, or on campus, they would be able to get home easily.
There’s variety of routes where we’re extending service by adding more frequent trips. A lot of people know that on Route #4, which is our Washtenaw Avenue route, our busiest ridership, we doubled the weekly frequency in January 2012 as kind of an advance implementation of this plan. That service was acutely successful and a year later we added more frequency on our Route #5, because we were having problems with capacity and on-time performance on that route.
As part of the service plan that we’re proposing, we’ve increased frequency and capacity on a number of routes in Ann Arbor. Route #2 is the route that serves the Plymouth Road area and north of Plymouth Road. We’re adding a bus midday to take care of problems we’re having with crowded buses on that route. We’re not able to accommodate the loads on that route at that time. We have service on a route that goes down to Briarwood and then out Ellsworth. That service is going to be doubled in frequency in 2017 in the plan. And we have a number of routes on the west side of Ann Arbor, where we’re redoing those routes. [White also described the reconfiguration of routes – converting some loops to out-and-back routes, which allows flexibility to extend service farther out in the future.]
Transit Service: Description of Improvements: Paratransit
Question: How are the paratransit and dial-a-ride services [A-Ride for people with disabilities and Good as Gold for seniors] being improved and how do people request this?
CHRIS WHITE: Every place we are increasing service hours, those service hour extensions apply to our door-to-door, paratransit services as well. It applies to new destinations as well. Our coverage in Ann Arbor is already such that the fixed-route improvements don’t mean a lot of new areas are served within Ann Arbor – improvements inside Ann Arbor are mostly in terms of frequency and time of day. But some locations have been added – the Pittsfield branch of the Ann Arbor District Library, the Costco on Ellsworth, the Quality 16 movie theater and the Meijer on Jackson Road. The AAATA is a little hesitant to talk about the Jackson Road locations, as an agreement would still need to be worked out with Scio Township on that. In Ypsilanti, the Ypsilanti District Library and the District Court are actually important destinations even for a lot of people from Ann Arbor.
MICHAEL BENHAM: The weekend and night service expands for paratransit service whenever we extend fixed-route service. That’s a huge expansion of service, if you don’t have to be in by 6:30 p.m. and can actually take in a movie and dinner.
CHRIS WHITE: Another thing that a lot of people don’t know about is that we have a tentative arrangement with the University Michigan so that the A-Ride service and the Good as Gold service goes to the East Ann Arbor Medical Center and Domino’s Farms. The University Michigan is actually paying for the additional cost of those trips. We have not been able to get an agreement to do fixed-route service yet.
Question: Can you talk about the LAC?
CHRIS WHITE: For a long time, we have established a group called the local advisory council (LAC) – a group of people with disabilities and seniors that is an advisory committee to our board, which meets monthly. A number of years ago we had a number of people who were agency reps on that. But we found that it’s actually much more effective to have people who are actually using the service. It’s been a very, very important group to us, because in essence there is mutual group training going on. We’re learning more about how they use the service and they are learning more about how transit operates and what some of our limitations are. So we get a group of people who have some expertise to give us really quality advice about what we can do to improve the service – door-to-door services, as well as how we can provide our fixed-route service. The LAC has been a real benefit to us over the years.
Transit Service: Why Large Buses?
Question: Why do you run such large buses, and why do you use such large buses all the time?
MICHAEL BENHAM: The peak hours do tend to be the busiest, but even off-peak tends to be pretty busy, particularly on certain routes. It’s only in the very off-peak routes that we have the less-used buses. We could switch to smaller buses during those off-peak hours, but then we would have two separate, duplicative fleets of buses to maintain. We’d need a larger bus garage. And we would have to maintain a whole different fleet and would have to buy that fleet. It is a trade-off. We do have a van ride program – that’s a fleet of small vehicles, 6-8 passengers, where the driver is actually one of the users of the bus. That is one of our answers to what we call low-density transportation, where you don’t have a lot of people traveling down a specific corridor. Demand-response service is another way we do that. And we’re also thinking about the possibility of smaller vehicles in some of the starter services on new routes where we would not expect to fill up a large bus on day one.
CHRIS WHITE: It’s particularly pertinent in this neighborhood. If you live on Earhart and Green road in this area, the bus that you can see most of the time is going to be empty: It’s near the end of the route. That bus may have been very full and probably was very full during other parts of the route. But as it gets to the end of the route, it’s emptying and emptying.
RESIDENT F: I was on the Route 2C six weeks ago, and there were five people when I got on, and there were 60 by the time I got off on campus.
Transit Service: Ward 2 Service
Question: Are there any plans to increase the frequency of buses for Route #2B on the weekends? Why are there no new bus routes in the northeast corner? What are my taxes going for? Will you consider route reorganization to improve crosstown transit time, if you are not heading in and out of downtown?
CHRIS WHITE: It’s about balancing demand and the level of services. The Saturday morning service on Route #2 is once per hour. But it increases to every half hour on Saturday afternoon. There are quite a few routes in the system that are just hourly service all day on Saturday. One of the things that we’ve seen some change in over the last few years is ridership during the off-peak hours. That’s what this service plan is supposed to address – some of that demand.
We’re seeing an increase in demand in the evenings and on Saturdays. Route #2 is not scheduled for an increase except for the fact that we’re going to do one earlier trip – that’s the only increase on Saturdays for Route #2. This area of town has changed significantly. Historically, this is a pretty low ridership area. But demand has grown significantly and we have seen a lot of increase in demand for service in this area. We provide service every 15 minutes all day on the trunk of the route, and then it divides into three alternatives that provide service less frequently in this area.
Question: Route 2 has three variants right now. Can’t that be split up and have a separate loop? I can speak from experience that part of the problem with lower rider volume is that people had taken the bus, but now they can’t depend on being able to go back out on the route they came in on in a timely manner – especially if they’re under a time constraint or they got delayed at their appointment or something. It can be an hour between buses – and for me that’s not acceptable. You can’t wait at a school or library for that period of time.
CHRIS WHITE: Yes. And part of this five-year service plan is to try to reduce those places where we just do hourly service. But there’s a limit to how much we can do. One of the things that we try to balance is that demand for service and the quality of service that we’re providing. On a fairly regular basis we look at low productivity service. There’ve been high levels of service provided in an area, and we have reduced it some if we did not generate the ridership to justify it.
The Chronicle could not survive without regular voluntary subscriptions to support our coverage of public bodies like the Ann Arbor Area Transportation Authority. Click this link for details: Subscribe to The Chronicle. And if you’re already on board The Chronicle bus, please encourage your friends, neighbors and colleagues to help support The Chronicle, too!


Thanks for this report. Two things I wanted to point out – reduced fares are also given to M-Card holders, and downtown employees enrolled in the $10/year getDowntown program. The AAATA is reimbursed $0.90 for each ride by the DDA – so that is a free ride, paid fully by tax dollars – or parking revenue dollars diverted from the general fund. The MRide reimbursement come partly in cash from U of M, but mainly in the form of Federal dollars (tax dollars). A free ride.
My question about the National Transit Database figures did not make it in here – perhaps because it was at the end? The cost per ride, in inflation adjusted dollars has been climbing every year. In 1996 it was $3.48 per ride, and in 2013 it is $5.05. This pulled from the NTD. The AAATA says todays cost is $3.36, but that is not what their reporting to the NTD says. This rising cost for each ride means that the amount of rides given for each dollar spent is going down, even as ridership slowly increases. In 1996 a dollar bought us .29 rides, in 2013, .19 rides. The amount of Total Operational Funds Expended more than doubled in the 15 years from 1996 to 2011 – from $14,466,100 to $29,531,465, but the ridership only increased by 60%. Lastly, the projected amount of tax dollars collected IF this millage passes is based on a flat-rate of the first year – 2014′s take, as it were. It does not take into account the increase in a property’s taxable value – which is steady here in Ann Arbor. This will result in more funds being collected than are accounted for in this 5-year plan. What will become of this additional money? Train station studies? Marketing? No one knows, and it is millions.
Jeff, I didn’t include your claims about the cost per trip made at the meeting, which you’ve repeated here, because I think your claims have the impact of sowing confusion, rather than giving a deeper understanding of AAATA’s efficiency. I did provide a chart showing the historical trend for that statistic for the AAATA based on the database variable, not a calculation I performed. You described at the meeting that you’d done a calculation based on data in the NTD to arrive at your $5.05 figure for cost per ride. It would be worth checking that calculation against the variable for that stat that’s available in the database.
Historically, here’s what the time series looks like for that stat:
That’s the series underlying the chart included in the article above. Those are just the figures for fixed route service cost per trip pulled from the database, not the result of a calculation.
The AAATA’s summary of operations for the five month period ending February 2014 shows a figure of $3.56: [link] That’s in line with the historical trend.
But you’ve calculated that the current figure is over $5. That suggests to me that you’ve miscalculated something.
Dave, thanks for the great review of the Ward 2 Town Hall. I attended the meeting, and your summary is very accurate. Thank you for correcting the misinformation about the cost per ride for AAATA. It is refreshing to see the formal data, instead of the piecemeal information provided by the first comment. I have been struck by the millage opponents’ apparent strategy of “throwing every possible argument out there, whether supported by data or not, and seeing if they can scare enough citizens to vote against the millage.” The most blatant example is the “52 AAATA managers” which has been completely discredited. Why wouldn’t the opponents check the accuracy of such a simple claim before making it?
I was struck by the chorus of fellow Ward 2ers that, somehow, a bus service should pay for itself. Well, I cannot think of many city services that pay for themselves. Water doesn’t, police and fire do not, garbage does not. But the community is better off when we pay for those things together,and for bus service as well. And, as someone who has worked on transportation issues for 35 years, I can assure you that car drivers (like me) do not pay the full cost of our driving–construction and maintenance of our national road system cost trillons of dollars of public monies, oil and auto companies have been publicly subsidized, and we don’t pay the full health and environmental costs due to air pollution and carbon emissions.
My bottom line is that we have a great bus system already, but I am happy to pay a bit more to have an even better system that will allow more of my fellow citizens greater mobility and reduce congestion and open up parking spaces for the rest of us.
For what it is worth, David Askin’s report is accurate about what transpired at the Ward 2 town hall meeting. However, many facts and considerations were not presented at the meeting.
For instance, the AAATA showed an increase of ridership from 4.2 million in 2004 to 6.3 million in 2013 and offered a graph with two vertical bars to display the change. The AAATA used this information to justify expectations for continued growth that will be covered by added services tied to the new millage. What was not explained was that in 2004 the UofM began its arrangement with the AAATA that allowed its faculty and students to ride without paying fares. Likewise in the same year the go!pass program began that allows employers downtown to subscribe to fee rides for their employees by paying an annual fee of $10 for each employee. Subsequent to the introduction of these two free-ride programs fare-paying ridership fell the next year and remained unchanged for the decade. Meanwhile, total ridership rose reflecting a annual progressive increase in free riders through 2008. Actually, total ridership reached about 6 million riders in 2008 and oscillated around this number since then, increasing by only 5% over the ensuing 5 years.
The reason that ridership flattened out after 2008 likely reflects that all UofM faculty and students and all employees wanting go!pass cards had been recruited to ride the bus. Few individuals who were not using the bus but had access to free rides offered by the UofM and by the go!pass program were left who could add to the ridership. In other words, the UofM free ridership program and the go!pass program were saturated.
Ridership statistics used in my analysis can be found in David Askin’s excellent comprehensive study of AAATA ridership published in his article, entitled “Column: Let Data Steer Local Transit Policy,” published in the annarborchronicle.com and accessible at this URL: [link]
The fact that total ridership has flattened out over the past 5 years means that the AAATA should not plan future expansion to allow for significant further ridership from existing residents of Ann Arbor. Furthermore, SEMCOG predicts that Ann Arbor’s population will only grow by 9,852, or only 8,6% over the next 30 years. [link] See page 48.
Therefore, the AAATA can not justify planned increase in services based on any increased ridership either from present residents who are not yet using the bus service or from population increases in the future. With 91% satisfaction with present services, per the AAATA’s recent survey, few Ann Arbor citizens seem to believe that increased bus frequency and late night expanded services are important.
It seems extremely logical to me that increasing the bus frequency on some busy routes, extending nighttime hours on many routes, and extending weekend hours on many routes, with a respected and efficient bus system, would increase ridership. Let’s say you ride the bus when it runs, but you want to take a trip when it does not run. If the millage passes, the bus now operates at that time. You can take the bus! This seems self-evident to me.
My daughter has taken the 2C bus from northeast Ann Arbor to downtown on Saturdays and wanted to take the bus back home, only to find that the last bus is at 6 pm. I have made a round trip with my car just to pick her up. That is a perfect example of a trip that will be possible if the millage passes.
The previous comment implicitly makes an assumption, also reflected in many comments at the recent Ward 2 forum, that “either you drive a car or ride a bus.” I am in my 50s, and this may in fact have been a reasonable assumption in the past for many people of my generation and older. But, I think younger generations are different–even if they own a car, they are making trip-specific decisions about which option is more convenient and environmentally preferable. I recently took the 2C bus to Central Campus and it was far cheaper and convenient than it would have been to drive my car. And there were over 50 people on that bus–think of the oil and carbon that we saved.
Finally, even those who do not ever take the bus benefit from a good bus system–more economic activity, less congestion, more parking spaces, less pollution. Not to mention living in an area where all of our citizens, including those not able to own or drive a car, can get around. Transit is a community good.
I am proud of our bus system, and want to make it better. I will be happy to pay a little more in taxes to support a better bus system.
@4: You have quite the crystal ball to know what all those riders and non-riders are doing and thinking and why, Donald.
“Therefore, the AAATA can not justify planned increase in services based on any increased ridership either from present residents who are not yet using the bus service or from population increases in the future. With 91% satisfaction with present services, per the AAATA’s recent survey, few Ann Arbor citizens seem to believe that increased bus frequency and late night expanded services are important.”
This conclusion isn’t supported by the preceding portion of the comment, which isn’t surprising since it’s simply not logically supportable.
As for the satisfaction survey, that’s an interesting interpretation. If I were asked how satisfied I am with the current service, I wouldn’t necessarily read that as, “What improvements would you like to see in the service?”, depending in part on what other questions the survey presented.
Also, ridership didn’t flatten out after 2008, it dropped (but not until 2010, according to the graph in the article). And then it rose the next four years to new all-time high levels. Are you really that confused or are you hoping that we are?
As Dave wrote in his column on this millage vote, there are no doubt reasons to vote against it, but misinterpreting the data isn’t one of them.