Mayoral Election Finance 2014: Charts, Maps
According to reports filed with the Washtenaw County clerk’s office, the four Ann Arbor mayoral candidates in the Aug. 5, 2014 Democratic primary have raised a total of $153,847 in itemized cash contributions. The filing deadline for pre-primary reports was July 25.
Based on Ann Arbor’s population of about 114,000, that works out to about $1.35 per resident.
All four mayoral candidates currently serve on the Ann Arbor city council: Sabra Briere (Ward 1), Sally Petersen (Ward 2), Stephen Kunselman (Ward 3) and Christopher Taylor (Ward 3).
Raising by far the most of any candidate was Christopher Taylor with $75,198. (The campaign reported a total of $75,698 in its filings, but that amount was $500 more than the contributions calculated by The Chronicle, based on the campaign finance itemized list.) [link to WC clerk filing by Christopher Taylor] Taylor’s total came from 365 contributions, with an average contribution of $206.
Next was Sally Petersen with $44,495 from 133 contributions for an average contribution of $334 per donation. Petersen’s total was boosted with a $10,000 contribution of her own and $15,000 from her husband. The $2,000 limit does not apply to candidates themselves or members of their immediate family. [link to WC clerk filing by Sally Petersen] That total does not include a $5,000 late contribution filed by Petersen, bringing the total she and her husband contributed to $30,000.
Raising $26,680 was Sabra Briere. That total came from 204 contributions, for an average contribution of $130. [link to WC clerk filing by Sabra Briere]
Raising $7,474 from 59 contributions for an average donation of $126 was Stephen Kunselman. He had been the first to announce his candidacy for mayor – before current mayor John Hieftje decided that he would not be seeking an eighth two-year term. [link to WC clerk filing by Stephen Kunselman]
By way of comparison, when Jane Lumm raised roughly $18,000 for her pre-general election race for Ward 2 council in 2011 and then raised $20,000 for the same period in 2013, those totals were considered remarkable.
Here’s a read-only link to the shared Google Spreadsheet used by The Chronicle to generate charts and maps: [2014 Mayoral Campaign Finance: Ann Arbor]
Below we present charts and maps to illustrate the distribution of donations by amount and geography.
Charts
Below are frequency distributions of donations grouped by size of the donation. In the last few years, winning campaigns for city council races have been characterized by distributions that skewed toward smaller donations.
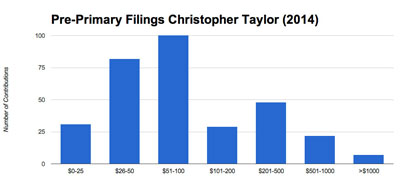
Taylor raised $75,198, which came from 365 contributions. The mean contribution to Taylor’s campaign was $206. The median contribution was $100.
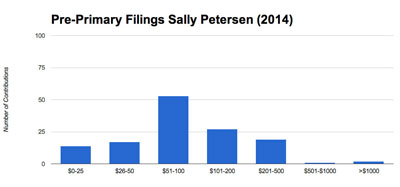
Sally Petersen raised $44,495 from 133 contributions for a mean contribution of $334 per donation. The median contribution was $100.
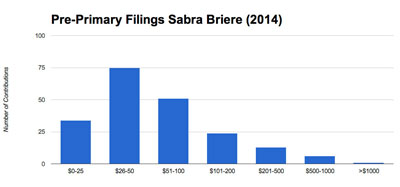
Sabra Briere raised $26,680. That total came from 204 contributions, for mean contribution of $130. The median contribution was $50.
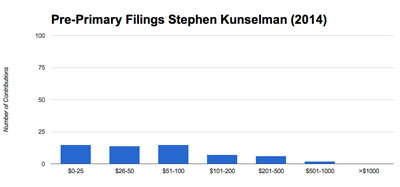
Stephen Kunselman raised $7,474 from 59 contributions for a mean donation of $126. The median contribution was $75.
Maps
The first map below, using red dots, plots all mayoral campaign contributions from the pre-primary filing data.
Maps: Taylor
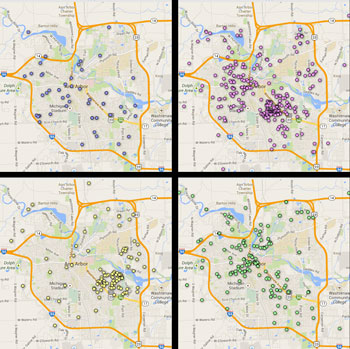
Christopher Taylor’s contributions are plotted in purple. They show a clear cluster in and around the Burns Park neighborhood where he lives (Ward 3). An additional high-concentration area of contributions is the central western part of town (Ward 5).
Maps: Petersen
Sally Petersen’s contributions are plotted with yellow dots. They show a clear concentration north of Washtenaw Avenue in the general vicinity of the Huron Hills golf course, where Petersen lives.
Maps: Briere
Sabra Briere’s contributions are plotted with green dots. The pattern is not dominated by clusters so much as stronger distributions in some parts of the city – the west (Ward 5), the north (Ward 1) and the southeast (Ward 3). Missing from that distribution are the southwest (Ward 4) and northeast (Ward 2) – areas that have historically had the strongest Republican support citywide.
Maps: Kunselman
Stephen Kunselman’s contributions are plotted with blue dots. The distribution is sparse, with no discernible clusters, but relatively even citywide, with the exception of the northeast (Ward 2).
The Chronicle could not survive without regular voluntary subscriptions to support our coverage of public bodies like the Ann Arbor city council. Click this link for details: Subscribe to The Chronicle. And if you’re already voting for The Chronicle please encourage your friends, neighbors and colleagues to help support The Chronicle, too!


With CM Petersen, the $30,000 that her and her husband gave are such outliers…. cut that money out and see what the mean/median are.
Re: “…cut that money out and see what the mean/median are…”
One reason the median and mean are often reported together as measures of central tendency is that the median is not nearly as sensitive to outliers as the arithmetic mean. From the fact that a dataset (like Petersen’s contributions) has a mean of $334 but a median of $100 you can tell there are outliers on the high side included in that data set.
Reporting both measures of central tendency using all the data is, I think, a better strategy than selectively eliminating data and then computing whatever “average” seems appropriate.
On a related point, note that there are several outliers on the low end in Taylor’s dataset. Why anyone contributes $1 to a political campaign is beyond me, but the effect of that contribution is to drive down the arithmetic mean. Same with the several $5 donations – which Taylor’s campaign on at least one occasion (after close of books, however) explicitly solicited in that amount. Do you say, “Oh, well, that’s not a legitimate donation for my analysis, so I’ll just eliminate it.”? My answer is no.