Column: Let Data Steer Local Transit Policy
Voters in Ann Arbor as well as in Ypsilanti and Ypsilanti Township will be asked sometime in 2014 to approve a transit millage – to be levied by the Ann Arbor Area Transportation Authority (AAATA). A vote by the AAATA board to place a question on the ballot is likely to come at its Feb. 20 meeting.

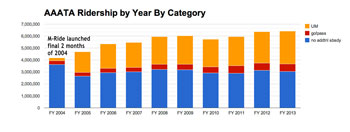
Fixed-route AAATA ridership by year and by category: no additional subsidy (blue); go!pass downtown employees (red); University of Michigan affiliates (yellow). (Data from AAATA, charted by The Chronicle.)
If it’s approved, the five-year millage will be used to pay for a range of service increases, focused on increased frequency for some existing routes, new routes, longer hours of operation and added hours on weekends.
In that context, I think it’s worthwhile to start getting a firmer grip on current ridership levels and historical trends.
In the last 10 years, AAATA fixed-route ridership – the “regular bus,” as contrasted with paratransit services – has grown from 4.2 million in fiscal year 2004 to 6.4 million rides in 2013. That’s about 50% growth.
And ridership in FY 2013 was consistent with that continued upward trend. But the trend this year was just slightly upward: The 6.4 million fixed-route rides provided in 2013 was barely up from 6.35 million rides in 2012 – about a 0.8% increase.
Two programs that offer financial subsidies to passengers – MRide and go!pass – showed a greater increase in ridership than the most recent overall trend. Rides taken on AAATA buses through the University of Michigan’s MRide program showed an increase of about 5% between 2012 and 2013 – from 2.61 million to 2.74 million rides. And rides taken with the go!pass, funded in largest part by the Ann Arbor Downtown Development Authority – increased about 4% between 2012 and 2013 – from 604,000 to 629,000 rides.
I’m going to use the term “out-of-pocket ridership” for those rides not supported through an additional subsidy from the go!pass or MRide programs. Out-of-pocket ridership actually showed a decrease of about 3% from 2012 to 2013 – from 3.15 million to 3.04 million rides.
A more detailed look at the historical ridership data by category has implications, I think, for reasonable community expectations for future out-of-pocket ridership – if a millage is approved and service improvements are implemented. And that more detailed look also has implications for a reasonable basis for negotiations between AAATA and the University of Michigan on the financial component of the MRide deal.
Here’s a quick summary of my thoughts. I think the success of the five-year improvement plan should be measured in part by increases in out-of-pocket ridership. I think the MRide agreement between UM and the AAATA should include not just a fare component but also a component to cover UM’s “local share.” And I think the go!pass program should be conceived as a tool to help increase general out-of-pocket ridership, not just serve to benefit people who have a formal affiliation with downtown Ann Arbor.
You’ll find a more detailed analysis of these issues below the fold. This column also includes more charts – and even some maps with colored dots. [Full Story]


