Ann Arbor Parking Data: Slower September
The board of the Ann Arbor Downtown Development Authority will face a relatively light agenda for its post-election-day meeting scheduled for Nov. 7. But the meeting will include the usual routine update on usage statistics for Ann Arbor’s public parking system.
And while the most recent figures show revenues to be slightly better than expected for the quarter ending Sept. 30, revenues for just the month of September 2012 showed only a 3% gain against September 2011.
All other things being equal, the 3% revenue increase could be analyzed as increased usage of the parking system. But a couple of significant factors were not equal: total spaces available in the system, and parking rates. Both factors increased significantly more than 3%, indicating a dip in usage.
In September 2012, Ann Arbor’s public parking system offered about 12% more spaces than in September 2011 – 7,824 compared to 6,974 a year ago. Much of that increased inventory is due to the 738 spaces in the new Library Lane underground parking garage.
And parking rates increased 7-9% system-wide in September: Hourly parking structure rates increased from $1.10/hour to $1.20/hour; hourly parking lot rates increased from $1.30 ($1.50 after 3 hours) to $1.40 ($1.60 after 3 hours); hourly parking meter rates increased from $1.40/hour to $1.50/hour; and monthly parking permit rates increased from $140/month to $145/month.
The count of hourly patrons in the system is also consistent with a usage drop for September 2012 compared to September a year ago – 171,107 compared to 194,034 last year, or nearly 12% fewer patrons.
Discussion of the September parking system revenue totals at the DDA’s operations committee meeting on Oct. 31, 2012 included several factors that might account for the usage drop. In September 2011, the University of Michigan played four home football games, compared to just two this year. And September 2012 included one fewer business day (24 compared to 25) and one fewer weekend day (8 compared to 9) than September 2011. In addition, September 2012 did not include the Friday before Labor Day.
September revenue totals also reflect the fact that one segment of parking customers paid less, despite consistent usage. Holders of monthly permits in structures near the UM campus were offered a substantial discount to move their permits to the new underground Library Lane parking garage – $95 compared to the $145 regular rate. So a portion of the roughly 415 monthly permits that have been sold for the Library Lane garage reflect the discounted rate.
September was the first full month the Library Lane garage was open, without any part of it closed off for construction inspection activity. The garage showed modest revenue gains compared to last month. But somewhat as expected, it is initially lagging behind other facilities measured by revenue per space – $77 per space compared to a system-wide average of $196.
The public parking system will be adding more spaces sometime in mid-March 2013. At the DDA’s operations committee meeting, DDA executive director Susan Pollay indicated that current projections are for the DDA to take possession of the first two floors of Village Green’s City Apartments project on March 15, 2013. The building – located at First and Washington – will contain a 244-space parking deck on those first two floors, 95 of which are to be available for public parking. The rest of the spaces will be used by residents of the 146-unit project, when the construction is completed.
Graphs and some discussion of other ways to measure parking system performance are included in this report.
System-wide Performance
The number of hourly patrons in Ann Arbor’s public parking system for September 2012 was the lowest of any September in the last four years:

Ann Arbor Public Parking System: Total patrons (green trend line) for September 2012 was a four-year low.
After consistently significant year-over-year revenue gains for the last three years, the 3% increase for September 2012 compared to September 2011 suggests a possible slowing of usage growth – especially in light of the increased capacity of the system and the increase in rates:

Ann Arbor Public Parking System: Total revenue (green trend line) for September 2012 dipped to just about last year’s levels, despite about 10% more spaces available and a rate increase.
System-wide, the growth in average revenue per space appears to have slowed, relative to rate increases. The 738 spaces in the new Library Lane parking garage account for roughly 10% of the system total, so adding 10% to the denominator of the fraction, without a commensurate gain in revenue, will result in a smaller number:
Performance by Facility
The surface lot at Huron/Ashley/First continued the trend of generating the highest amount of revenue per space for any surface lot (or actually any facility) in the system:

Ann Arbor Public Parking System: Revenue per space, focus on surface lots. The Huron/Ashley/First surface lot is the red trend line.
The new Library Lane garage – somewhat as expected – is showing initial revenue per space performance that is significantly less than other structures in the system. As some monthly permits are transferred from the Maynard and the Liberty Square structures to the new Library Lane garage, the revenue per space in those structures should start to climb – as spaces are used by more hourly parkers, who pay relatively more than permit holders:
Measures of Performance
Despite the apparent drop in usage of the public parking system for September 2012 compared to September 2011, the DDA’s budgeted revenues for the parking system are still on target for the first quarter of the fiscal year 2013, a three-month period that ended Sept. 30. [.pdf of parking budgeted revenues]
The DDA had budgeted $4,520,989 in total parking system revenue and the actual revenue came in at $4,629,763, or about 2.4% better than budgeted.
While financial performance is correlated with usage, conclusions about actual usage can’t be read straight from revenue figures, especially when rates increase – by different amounts for different categories of parking – or when capacity increases.
The number of hourly patrons is a measure that the board receives as part of its monthly reports – a measure that is independent of revenue. But the hourly patrons statistic doesn’t include any information about how long patrons are staying – which sometimes results in speculative conclusions. One such speculative conclusion might be this: Hourly patrons are down, but revenue is up, so they must be staying longer.
The DDA board has in the recent past used other, non-financial ways of looking at system performance, but on a more or less ad hoc basis.
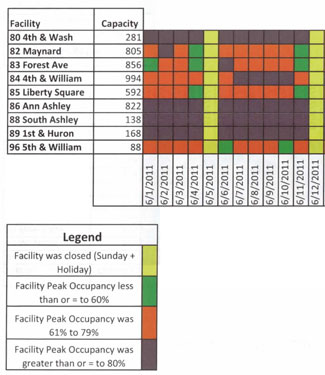
Those methods include looking at peak occupancy by facility, which essentially convinced the board that most of the public parking facilities “max-out” their capacity on a daily basis. [.pdf of peak occupancy data]
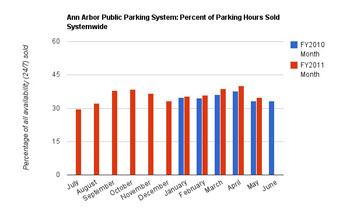
A non-financial method that includes off-peak usage focuses on the number of parking hours used. In the summer of 2011, the DDA board’s operations committee was presented with charts showing the ratio of parking hours sold to parking hours available – a statistic which is independent of revenue.
However, the idea of including efficiency data as part of the routine reporting on the parking system has not gained any traction on the DDA board.
The Chronicle could not survive without regular voluntary subscriptions to support our coverage of public bodies like the Ann Arbor Downtown Development Authority. Click this link for details: Subscribe to The Chronicle. And if you’re already supporting us, please encourage your friends, neighbors and colleagues to help support The Chronicle, too!


Excellent report.
I think it is a stretch to use the lack of two home football games as an explanation for a decline in parking revenues.
Many Ann Arbor folks plan their downtown weekends based on the absence/presence of home football traffic, meaning that more people might venture downtown on a non-football weekend. Second, I don’t see lots of folks trekking from downtown structures to the stadium.
Next thing, the city will start looking at cloudy days to explain away the poorer usage.
The DDA also changed the way hourly parking is charged in the structures, going from charging in 30-minute increments to charging in 1-hour increments. While not technically a rate increase, this surely resulted in higher revenues.
Watch for more 4-year lows in hourly patron numbers over the coming FY and maybe even revenues lower than ’11-’12 levels beginning in early ’13 (in spite of the rate increases).
The hourly patron numbers for surface lots and the Washington & 4th structure might be the beginning of a downtrend, primarily among shoppers/eaters. The numbers for the structures won’t drop til later after employment drops, more employees work from home, and businesses close.
Dave, can you get data for ’07-’08 and ’08-’09? That’s where the patron numbers are headed.
As Tom notes, it’s a bit misleading to say “rates increased from $1.10/hour to $1.20/hour.” A 30 minute stay that used to cost $.55 is now $1.20, more than double what it was.
Yes, and I attended a one-hour meeting that took me back to the parking structure about 5 minutes past the hour, so I paid $2.40 for about 70 minutes. It makes one think twice.
Jim and Tom, the change to the billing methodology you’re referring to (from half-hour to hourly) was implemented in February, not just recently in September like the rates. This was reported and analyzed as a part of The Chronicle’s February 2012 DDA board meeting report. It certainly could have been adduced in the current article as an additional point in support of the conclusion that this September’s revenue increases were not as great what might have been projected based on inventory and rate increases – because the “effective” rate increase (due to the February billing change) from September 2011 to September 2012 was even greater that the stated increase.
The billing change alone can be estimated to generate something an additional $0.5 million in annual revenue. Yet in the data I’m working with, I’m not sure I can identify the effect of that specific billing change from February 2012 to March 2012, or anywhere else. Yes, there’s some evidence that March revenues per space increased compared to February at some facilities, but the same increase is apparent from February 2011 to March 2011. This is another case where a reliance primarily on financial measures for system performance limits our understanding of how the parking system works. If we routinely reviewed data on the number of hours of parking sold by facility, then we’d be able to compute a statistic: (hours of parking sold) / (hourly patrons) = (average length of stay). [My recollection is that I've seen monthly parking reports from the "olden days" that showed this stat, but a cursory search just now failed to turn any up.] I’d speculate that what we’d see from February to March in 2012 would be an average length of stay that increased, but perhaps not because patrons are actually staying longer, but because they’re being billed for longer.
In any case, I didn’t repeat the discussion of the billing change in this article, because the basic conclusion here is well-supported even without bringing up the issue of the billing change. That conclusion is: Stable usage would have resulted in revenue increases significantly greater than 3% – so usage wasn’t stable and in fact went down.
Sorry Dave, my intent was to criticize the City’s hidden rate increase, not your stellar reporting. Thanks for the analysis.
A very interesting report. Do we have a way to know what kind of turnover we have on the meters? It seems like street parking is still too cheap. As for charging by the hour or fraction thereof in the structures, it is counterproductive to freeing up street spots.
There’s a lot more data to be had, but it’s hidden inside the private side of the public-private partnership that manages the structures.
I’ll note that the real-time “spaces available” feed that used to grace the Ann Arbor DDA’s site is still down: [link]
“Parking data is temporarily unavailable. Sorry for the inconvenience.”