Column: Taxing Math Needs a Closer Look
A bit more than a month ago, the Ann Arbor Downtown Development Authority board was poised to ratify a new contract with the city of Ann Arbor, under which it would continue to manage the city’s public parking system. But at noon on May 2, when board members met, they were greeted with some news that caused them to postpone their vote on that 11-year deal, which called for 17% of gross parking revenues to be transfered to the city of Ann Arbor.
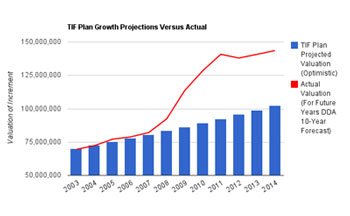
Blue bars represent the "optimistic" projections of the increment valuation in the Ann Arbor DDA's TIF plan. The red line represents actual valuation of the increment on which taxes have been captured. For 2013-2014, the valuation is based on estimates in the DDA's 10-year planning document.
That news had been conveyed to DDA staff by the city of Ann Arbor’s finance department just that morning: Some of the taxes captured in the DDA’s tax increment finance (TIF) district since 2003 might be owed to local taxing units, including the city. With an uncertain financial obligation to return TIF monies that had already been captured from taxing units in the district, the DDA board understandably balked at approving the new parking contract on May 2.
The postponement of the DDA’s vote on that contract ultimately led to a delay in the Ann Arbor city council’s adoption of the city’s fiscal year 2012 budget – as the council stretched its May 16 meeting to May 23 and then on to May 31. But by the end of May, the issue of excess TIF capture had been settled to the DDA board’s satisfaction, and the parking contract was ratified – first by the DDA, and then by the city council.
The Ann Arbor city council was also content with the DDA’s proposed solution to the excess TIF capture. That solution included returning a total of roughly $473,000 to the Ann Arbor District Library, the Washtenaw Community College and Washtenaw County. The city of Ann Arbor chose to waive its $712,000 share of the calculated excess.
Those three other taxing units no doubt welcomed the news that their budgets would get an unexpected boost. But the governing bodies of those taxing units should take a closer look at how the excess TIF was calculated. If they do, they will discover that the amount actually due to be returned to them (and divided proportionately as required under the city’s of Ann Arbor’s DDA ordinance) may not be $473,000, but more than twice that: $1.27 million. In ballpark numbers, for the Ann Arbor District Library that translates to the difference between about $75,000 and $200,000. For Washtenaw County, it’s the difference between $242,000 and $648,000. And for Washtenaw Community College, it’s the difference between $157,000 and $419,000.
Brief Background on TIF
A tax increment finance (TIF) district is a mechanism for “capturing” certain property taxes to be used in a specific geographic district – taxes that would otherwise be used by the entity with the authority to levy the taxes. So in the DDA’s TIF district, the DDA doesn’t levy taxes directly. Rather, a portion of the property taxes that would otherwise be collected by taxing units (like the library, community college and the county) is instead used by the Ann Arbor DDA for improvements within a specific geographic district, covering about 66 city blocks downtown.
What is the portion of the property taxes that is captured by the DDA? The captured tax is only that which applies to the difference between (1) the baseline value of the property when the district was first formed, and (2) the value of the property after new construction or improvements to the property. That difference is the “increment” in “tax increment finance.” Subsequent appreciation of property value due to inflation, after it’s been constructed or improved, is not included in the Ann Arbor DDA’s TIF capture.
What the Ordinance Says
Chapter 7 of the city of Ann Arbor’s city code lays out how the tax capture of the Ann Arbor DDA is limited, or capped. The mechanism used to cap the amount of tax that can be captured by the Ann Arbor DDA is the projected value of the increment in the TIF district, as laid out in the TIF plan – a required document under the state enabling legislation for DDAs (Act 197 of 1975). From Chapter 7 [emphasis added]:
If the captured assessed valuation derived from new construction, and increase in value of property newly constructed or existing property improved subsequent thereto, grows at a rate faster than that anticipated in the tax increment plan, at least 50% of such additional amounts shall be divided among the taxing units in relation to their proportion of the current tax levies. If the captured assessed valuation derived from new construction grows at a rate of over twice that anticipated in the plan, all of such excess amounts over twice that anticipated shall be divided among the taxing units. Only after approval of the governmental units may these restrictions be removed. [.pdf of Ann Arbor city ordinance establishing the DDA]
The TIF plan includes a table that lays out the projected valuation of the increment in the district, starting in 2003. The table includes three scenarios for the projected valuation: “realistic,” “optimistic” and “pessimistic.” They’re each based on a constant percentage increase each year. So the three different scenarios are generated from three different estimates of the percentage increase each year. [.pdf of DDA TIF plan appendix]
Before this year, Chapter 7 has not been applied, although it should have been. The mayor, city financial staff, and DDA board members have offered as an explanation that it was an honest mistake: No one had gone back to check old ordinances.
Interpreting the Chapter 7 limit on TIF capture requires answering at least two questions: (1) Which of the three projections (“realistic,” “optimistic” or “pessimistic”) is relevant for the application of the ordinance? and (2) Is the growth in valuation supposed to be measured year-to-year, or cumulatively?
While the language of the DDA ordinance is vague, I think the correct answer to these questions is actually straightforward. However, in both cases, that answer is different from the one used by the DDA in calculating the amount of excess TIF to be returned to the taxing units.
Question One: Realistic vs. Optimistic vs. Pessimistic
The DDA’s answer to the question of which projections to use is this: Use the “optimistic” projections.
One kind of argument for that interpretation of Chapter 7 might be to observe that the numbers in the optimistic column qualify as “anticipated in the tax increment plan” because they are included in the table, thus are clearly “anticipated.” But the “pessimistic” scenario is also included in the plan, thus it also qualifies as “anticipated.” So an argument based on what is “anticipated” will not discern one scenario from another, and thus must be rejected as the basis for answering the question. What’s required is some basis for choosing one scenario instead of the others.
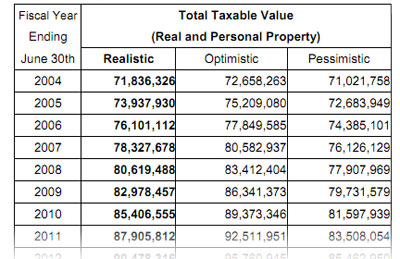
Extract from the Ann Arbor DDA's TIF plan table. It shows the projected valuation of the increment on which the DDA's TIF capture will be based.
An argument for the “realistic” scenario could be based on the usual meaning of the words used as labels for the scenarios. On this argument, the two scenarios that are not labeled “realistic” are unrealistic, thus not suitable for use in the application of Chapter 7. While it is persuasive, I think this argument is not completely definitive, because it trades on the perhaps arbitrary or accidental choice of particular words as labels. One could imagine a TIF plan that is identical to the Ann Arbor DDA’s TIF plan, except that the table of projections uses “middle,” “high,” “low” as labels for the different scenarios. And in that case, I think it’s not as straightforward to reject the high and low projections, merely because they are both “not the middle one.”
However, I think two arguments exist that are definitive. One was made by councilmember Stephen Kunselman (Ward 3) at the city council’s May 31 session. He simply noted that the column of numbers labeled “realistic” is the one displayed in bold typeface in the TIF plan. The fact that it’s bolded allows a reader to discern that it’s meant to be special and different from the other two, independently of the meaning of the words used as labels. This allows for a definitive choice of the “realistic” projections, even if it’s not known to what purpose the projections will be applied.
A second definitive argument is related to the purpose of the calculations, and it’s based on the principle of fairness. The three scenarios are fairly described as middle, high and low. We know that the purpose of the calculations is to divide money between two interested parties based on the choice of either the middle, high or low scenario. Further, we know that the choice of the high scenario will benefit one of the parties, while choosing the low scenario will benefit the other party.
Imagine that we present the choice to an independent arbiter, who does not know the nature of the calculations to be done with the numbers, or which party would benefit from a choice of the high or low numbers. The only fair choice available to the arbiter is to choose the middle set of numbers, because it’s the only set that rejects an arbitrary assignment of benefit to one or the other party.
At the DDA’s May 2 board meeting, board chair Joan Lowenstein indicated the possibility that an independent auditor might need to decide the question of excess TIF calculations. To The Chronicle’s knowledge no independent party has weighed in on the issue.
Question One: Impact on Calculations – Realistic Scenario
Holding everything else constant in the DDA’s calculation of excess TIF capture – except for the choice of the “realistic” scenario instead of the “optimistic” one – yields a total of $1,302,992 that should be returned to taxing units in the DDA TIF district. That compares to $1,185,132 that the DDA calculated – a difference of $117,860.
The impact of choosing the “realistic” projections in the TIF plan – as opposed to the “optimistic” projections – is relatively modest, but I would contend it is still significant in absolute terms.
Question Two: Year-to-Year vs. Cumulative Method
Before we even try to frame the second question, it’s worth considering some hypothetical examples, in order to develop an intuition for the issue. In the Chart B below, the blue bars represent the forecast valuation of the increment in some hypothetical TIF plan for some hypothetical DDA. The pink line represents what actually happened (in this hypothetical scenario).
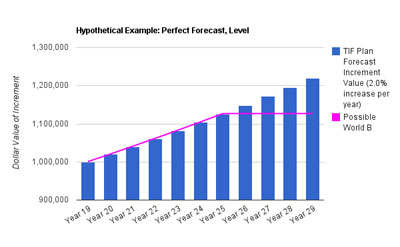
Chart B. A hypothetical TIF plan forecast (blue bars) with hypothetical valuations of the increment (pink line).
In the Chart B example, the amount of new development in the district exactly matched the forecast in the TIF plan in Year 19 through Year 25. For those years, the amount of growth in TIF capture is exactly what was forecast. So, for those years no excess as defined in Chapter 7 could possibly exist. What about Year 26? The valuation of the increment stayed constant from Year 25 to Year 26, leaving the valuation in Year 26 less than what was forecast. So for Year 26 through 29, no excess as defined in Chapter 7 could possibly exist.
I don’t think Chart B is in any way controversial: The growth in valuation of the increment is not greater than anticipated in the plan.
But consider now Chart A, which is identical to Chart B except for the actual valuation from Year 19 through Year 24, which remains flat, until climbing – all at once – in Year 25:
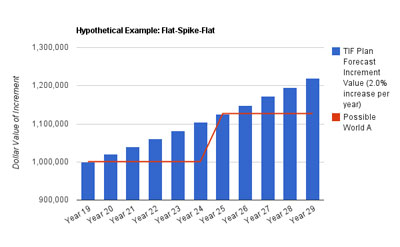
Chart A. A hypothetical TIF plan forecast (blue bars) with hypothetical valuations of the increment (red line).
We already concluded that there’s no excess in Chart B. But comparing Chart A and Chart B, the valuation in Chart A (red) is less than or equal to the valuation in Chart B (pink) in every year. It’s therefore counterintuitive that Chart A would reflect excess valuation compared to the forecast in the TIF plan – Chart A’s valuation is everywhere less than or equal to a valuation history that patently shows no excess.
Yet on the methodology used by the DDA to calculate excess TIF capture, Chart A shows excess valuation compared to the TIF plan. How can that be?
Here’s how it works. In any given year, the DDA’s method compares that year’s valuation to the prior year’s valuation, and calculates the difference as actual growth. [In the .pdf of table showing DDA's calculations in detail, that is column D.]
Then the DDA’s method compares the TIF-plan-forecasted valuation for that year to the prior year’s forecasted valuation, and calculates the difference as forecasted growth. [In the .pdf of table showing DDA's calculations in detail, that's column H.] Comparing actual to forecasted growth in this manner is what determines excess, according to the DDA’s method. [D minus H, in column I] Because the DDA’s method depends only on checking the prior year, we refer to it informally as a year-to-year method of excess calculation.
So in Chart A, for Year 25, the actual growth since Year 24 (the difference in red line values) is significantly greater than the forecasted growth since Year 24 (the difference in blue bar values). It’s because of that difference that the year-to-year method results in the determination that excess growth has occurred in this hypothetical situation. The year-to-year method thus leads to what I’d consider to be an absurd result in this hypothetical example – so on that basis, it can be rejected as incorrect.
In the Chart A hypothetical example, the year-to-year method works in favor of the taxing units and against the DDA. So rejecting the year-to-year method of calculation as counterintuitive actually defends the DDA’s interests – at least for this kind of hypothetical example. That is, rejection of the DDA’s method is not based on some pre-existing bias against the DDA, but rather entirely on the fact that it leads to an absurd result.
If not the year-to-year method, then, what method should be used for determining whether excess TIF growth has occurred? I think it’s straightforward to compare the red/pink lines to the blue bars. If a red/pink line is higher than the blue bars, then there’s excess, defined exactly as the difference between the red line and the blue bars. If the red/pink line is the same height or lower than the blue bars, then there’s no excess.
A possible argument against this approach is that Chapter 7 speaks to the growth rate. Comparing the forecast valuation to the actual valuation (red/pink lines to blue bars) does not seem to compare growth rates. It compares two numbers – a forecast valuation and an actual valuation – which are not themselves rates. That argument is refuted by noting that comparing forecasted valuation to the actual valuation is mathematically equivalent to comparing the rate of growth forecast since the start of the TIF plan to the rate of actual growth since the start of the period.
We refer to this approach informally as the cumulative approach. With the cumulative approach, instead of looking back just to the prior year to determine whether there’s been excess growth in any year, we look back to the beginning of the period of the forecast. Using Chart A as an example, for Year 25 we compute the difference between the actual valuation (red line) in Year 25 compared to Year 19. We then compute the difference between the forecasted valuation (blue bar) in Year 25 compared to Year 19. Those two differences are the same, so the cumulative approach determines there is no excess in Chart A, which matches intuition.
Let’s now move from the hypothetical realm to the actual facts of the valuation of the increment in the Ann Arbor DDA TIF district:
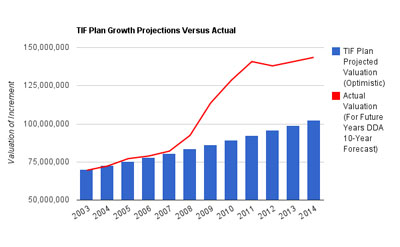
Chart C. Blue bars are the forecast valuation (optimistic scenario) in the Ann Arbor DDA's TIF plan. The red line is the actual valuation. For years 2013 and 2014, the DDA's 10-year plan is used.
The easiest way to see the difference between the year-to-year method and the cumulative method is in year 2012. The actual valuation (red line) in 2012 drops compared to 2011. So on the year-to-year method, there can be no excess for that year – no matter what the forecast is (blue bars). I think that’s an absurd outcome – which arises because the year-to-year method incorrectly re-sets the benchmark for calculating the growth rate to the immediately previous year. In contrast, the increment on which TIF is captured is not re-set this way every year – so why should the definition of excess include this type of re-setting?
The cumulative method, on the other hand, would (reasonably) determine that there is an excess for 2012. Even though the valuation dips from 2011 to 2012, the red line is still clearly higher than the blue bars.
This also highlights the fact that the year-to-year method does not impose an actual cap on the total TIF capture by the DDA for the period of the DDA’s existence. It only imposes a cap on the capture in any given year – which is defined relative to just the preceding year.
If the valuation of the increment spikes in the district, then in the first year of the spike, the year-to-year method calculates an excess valuation due to that spike. But after that spike levels off, the year-to-year method determines there is no excess. And even if an upward growth trend continues, the year-to-year method does not carry forward the excess from previous years in the same way that the cumulative method does. The year-to-year method effectively re-sets the benchmark each year against which growth is measured.
Question Two: Impact on Calculations – Cumulative
Holding everything else constant in the DDA’s calculation of excess TIF capture – except for the choice of a cumulative method instead of the year-to-year method – yields a total of $2,400,659 that should be returned to taxing units in the DDA TIF district. That compares to $1,185,132 that the DDA calculated – a difference of $1,215,527.
The impact of choosing the cumulative method of calculation, as opposed to the year-to-year method, is therefore very substantial.
Combined Effect on Calculations: Present, Future
The impact on the calculation of excess TIF is amplified further, if both alternate methods are combined – the cumulative method and the “realistic” TIF plan projections. The total comes to $3,170,930 of excess TIF captured since 2003. Even if the city of Ann Arbor were to waive its share of the excess, the DDA would still owe the other taxing units a total of $1,266,612 for excess TIF captured since 2003.
Perhaps more importantly, the amount of TIF captured by the DDA under the cumulative method with the “realistic” numbers would be diminished considerably in future years. For the period of the current 10-year plan used by the DDA for its planning, it would mean between $600,000 to $900,000 per year less TIF revenue than the DDA has currently planned.
Links to publicly available Google Spreadsheets with calculations used in this op-ed:
- Excess TIF: Optimistic, Year-to-Year (DDA calculations)
- Excess TIF: Realistic, Year-to-Year (Chronicle calculations)
- Excess TIF: Optimistic, Cumulative (Chronicle calculations)
- Excess TIF: Realistic, Cumulative (Chronicle calculations)
Conclusion
While the language of Chapter 7 is somewhat vague, I think it’s a straightforward matter to arrive at the correct answer to the questions we’ve considered here. Changing the method for calculating excess TIF clearly has dramatic implications for the taxing units in the DDA district, as well as for the DDA itself. But the issue has received little public scrutiny by the city of Ann Arbor.
Indeed, at the May 31 session of the city council’s May 16 meeting, Ward 3 councilmember Stephen Kunselman lamented the fact that accompanying the council’s resolution on the subject, there was no city staff report explaining the calculations for the DDA excess TIF capture since 2003. The response Kunselman heard from the city attorney’s staff at the meeting was simply this: It’s the DDA’s responsibility. But in point of fact, the city of Ann Arbor collects a 1.0% tax administration fee for performing the tax collection for all the local taxing units, processing the taxpayers’ money and distributing it to various taxing units, including the distribution of TIF capture to the DDA.
Further, Chapter 7 is a city of Ann Arbor ordinance. As such, the city attorney is charged by the city charter with the responsibility of prosecuting any violation of Chapter 7. The way the excess TIF has been calculated by the DDA could be construed as a violation of a city ordinance. It’s therefore the city attorney’s responsibility to prosecute the violation or ask the DDA to cure it. Alternatively, the city attorney could write an opinion (and file it with the city clerk, as required by the city charter), making clear why the DDA’s method of calculation is justified.
I don’t think it’s possible to justify it. But I may have overlooked something. Or my calculations might contain errors. Or I might be wrong in other ways.
Certainly the city of Ann Arbor has little to gain and much to lose by pressing the issue, because the financial health of the DDA is important to the city in a way that’s different from the DDA’s importance to other taxing units. Even though the new parking contract with the DDA provides 17% of gross parking revenues to the city of Ann Arbor, the DDA might have a difficult time making those parking revenue transfers, if the excess TIF capture is calculated in the way I’m suggesting it should be figured.
That could mean that a new clause in the parking contract – under which the city has pledged to backstop the DDA’s fund balance – could come into play, against anyone’s expectation. Under the clause, the DDA can defer a total of $2 million in payments to the city over the course of five years, in order to keep its fund balance above $1 million.
For that reason, it’s unlikely the city of Ann Arbor – either its staff or its elected officials – will press for further scrutiny of the calculations.
So now it’s the responsibility of the Ann Arbor District Library board, the Washtenaw County board of commissioners and the Washtenaw Community College board of trustees to insist that their respective financial staff scrutinize the excess TIF calculations and to insist that the calculations are done correctly.
Purely a plug: The Chronicle relies in part on regular voluntary subscriptions to support our coverage of publicly-funded entities like those mentioned in this column. We scrutinize the use of every dime we receive from subscribers – just as closely as we scrutinize calculations on excess TIF. Click this link for details: Subscribe to The Chronicle.


This whole argument begs the question of why we established the TIF to begin with? Since we seem to be stuck with this one – maybe we should learn a lesson and not establish any additional TIF’s. I know I have just learned that lesson as my head is still spinning from your math. Thanks for the great article Dave. I vote for no more TIF’s!
~Stew
Kids ask teachers what math is good for–and teachers often don’t have a good answer. (See this post for an example: [link]
Thanks, Dave, for providing a really clear, real-life example of what math IS good for.
Nice job, David. This appears to be a good analysis of an interesting (to lawyers and accountants, anyway) issue and I look forward to working through your logic. A query, though. Maybe you dealt with this in earlier pieces but when it comes to the DDA and TIFs, the Font of All Wisdom is bond counsel. Not the DDA’s regular counsel but whatever firm is used to provide the tax-free status opinions on their bonds. Firms like Miller Canfield, Dickinson Wright and Dykema. These are the folks who draft the authorizing statutes for bond-issuing entities in the first place. Has anyone asked the views of whatever bond counsel firm is currently providing services to the DDA on this issue?