Transit: Ridership Data Roundup
Editor’s note: The Ann Arbor city council is currently contemplating a major decision on adopting the legal framework by which its local transit authority could transition to a countywide system of governance – or at least one that is geographically bigger than the city of Ann Arbor. The decision on ratifying a four-party agreement – between the city of Ann Arbor, the city of Ypsilanti, the Ann Arbor Transportation Authority and Washtenaw County – was postponed for the second time at the council’s Monday, Jan. 23 meeting. The council meets next on Feb. 6.
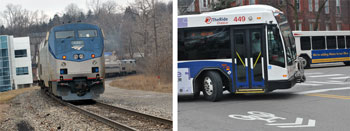
Amtrak train pulling away (despite appearances) from the Ann Arbor station on Jan. 25, 2012. Later that same day, Ann Arbor Transportation Authority buses converging on downtown Ann Arbor's Blake Transit Center. (Photos by the writer.)
The Chronicle is taking the pause between council meetings as an opportunity to offer readers a look at Ann Arbor’s current bus system ridership numbers over the last several years.
Part of a 30-year transit vision developed by the AATA includes the relocation of the Amtrak station – from Depot Street to a spot in the city’s Fuller Park. The proposed city/University of Michigan collaboration on the Fuller Road Station includes a large parking structure for the UM medical complex as its first phase. So we’re also taking a look at current ridership data on the Amtrak line through Ann Arbor.
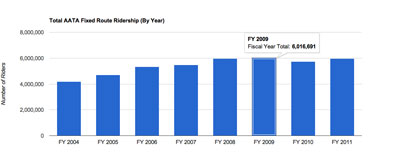
Ann Arbor’s regular fixed route bus system provided 5.95 million rides for fiscal year 2011, which ended Sept. 30, 2011. That’s slightly better than the previous year, but was slightly off the record high year of 6.02 million rides delivered in FY 2009. The first three months of the 2012 fiscal year – October, November and December 2011 – show slight increases over the monthly numbers for FY 2011.
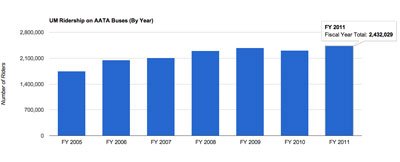
Of those 5.95 million rides provided by AATA in FY 2011, 2.43 million of them (41%) were provided through the University of Michigan MRide program – which allows faculty, students and staff of the university to board AATA buses without paying a fare. The cost for the service is paid by UM to the AATA. It was a record-setting year for the MRide program.
Also making up a portion of those 5.95 million rides were trips taken by holders of the getDowntown go!pass program, which allows downtown Ann Arbor employers to provide free bus passes for their employees for a nominal cost – the cost of the rides is funded through a grant from the Ann Arbor Downtown Development Authority.
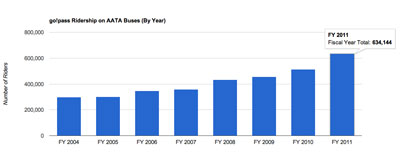
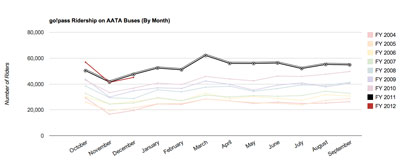
In FY 2011, 634,000 rides were provided under the go!pass program – a 23% increase over FY 2010, adding to the trend of monotonically increasing numbers of go!pass rides over the last decade. The first three months of FY 2012 don’t show the same kind of double-digit increases for go!pass use as FY 2011 – they’re tracking roughly the same as last year.
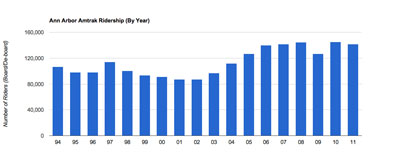
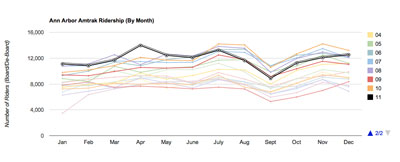
The number of riders getting on and off the Amtrak trains that passed through Ann Arbor during the 2011 calendar year was 141,522. That figure tracked close to the same level of activity the station has seen since 2006 – from 140,000 to 145,000 riders. Through May 2011, Amtrak was on pace to eclipse the record number of riders in 2010 (145,040). But starting in July 2011, ridership was lower in every month (compared to 2010) through the end of the year.
Charts and graphs by The Chronicle – as well as more detailed breakdowns – are provided after the break.
Overall Ridership on AATA Buses
AATA operates on a fiscal year that runs from Oct. 1 through Sept. 30. The data provided by the AATA to The Chronicle is organized based on that time period.
Fiscal year 2006 was the first year that AATA ridership crossed the 5 million-ride threshold on its regular fixed route service. By 2008, ridership was just under 6 million and actually nudged past 6 million in 2009. Ridership has remained relatively level over the four years from 2008 to 2011. In 2010, there was a dip of about a quarter million rides, but in FY 2011, the most recent full fiscal year, the number was again just shy of 6 million at 5,954,569. [See Figure 1.]
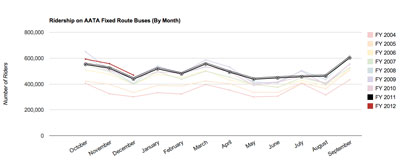
Figure 2 includes the ridership trend through the first three months of FY 2012 – October through December of 2011. Comparing the dark red line (FY 2012) with the heavy black line (FY 2011) shows an increase in each month of about 30,000 rides.
UM Ridership on AATA Buses
About 40% of rides on the AATA regular bus system are taken by University of Michigan students, faculty and staff under the MRide program. The program is commonly described as one that allows UM affiliates to “ride for free,” which is a chafing point for AATA public relations staff. The program does allow UM affiliates to board AATA buses without paying a fare. But the cost of the rides is intended to be compensated through payments UM makes to the AATA under the MRide contract.
The first MRide agreement was for a five-year period from Aug. 1, 2004 to July 31, 2009. When negotiations between UM and the AATA did not produce a new five-year agreement by July 31, 2009, the two organizations agreed to a one‐year extension of the original agreement for the period from Aug. 1, 2009 to July 31, 2010. Under that arrangement, UM paid AATA a total $1,987,642 to cover the cost of UM affiliate rides.
Then at its Sept. 16, 2011 meeting, the AATA board ratified a new five-year deal from 2010-2015. One difference between the previous agreement and the one that the board considered and approved at the Sept. 16 meeting is that the new arrangement makes explicit a per-boarding amount to be paid by UM. In the previous arrangement, UM agreed to pay a lump sum for the boardings, with additional money contributed through a federal grant for which UM is eligible.
While the federal grant is still a component of the new MRide arrangement, the boarding payment is now explicitly tied to the number of rides taken by UM riders. The current agreement is for UM to pay AATA $1 per ride. The regular fare for AATA buses is $1.50. The MRide rate is based on the cost per ride paid by holders of a 30-day pass, which costs $58. The previous arrangement had worked out to around $0.80 per ride, though it was not defined that way in the contract.
Although early in the MRide negotiations there was some consideration given to UM charging a partial cost of rides directly to its riders through the new swipeable fare box technology recently installed in AATA buses, that possibility was quickly taken off the table.
The count of UM riders is achieved by UM riders swiping their MCards through the AATA fareboxes. However, the usage data is provided to UM, and AATA does not have access to statistics on who is riding the buses – faculty, staff, or students. That information can be analyzed by UM, however.
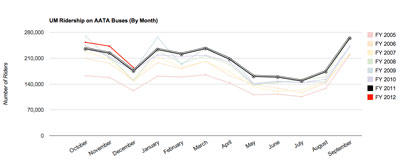
By 2008, ridership in the MRide program had more or less stabilized at around 2.3 million rides per year. In the most recent year – FY 2011 – the program had 2.4 million rides [see Figure 3]. The monthly trend for the first three months of FY 2012 shows an increase in MRide program ridership in each month, compared to FY 2011 [see Figure 4]. In December 2011, that increase was only about 10,000 rides, compared to almost 20,000 more rides in January and February. December is a typical trough for MRide ridership numbers, which show seasonal variation tied to the academic calendar.
go!pass Ridership on AATA Buses
Another bus pass program accounts for about 10% of AATA regular bus ridership – getDowntown’s go!pass program. Under the program, downtown Ann Arbor employers can purchase bus passes for their employees at $10 apiece. Participating employers must purchase passes for all their employees. The passes are good for unlimited rides on AATA buses.
The cost of the rides has historically been carried by payments from the Ann Arbor Downtown Development Authority out of its parking fund. At its June 2, 2010 meeting, the DDA board authorized a three-year grant to fund the go!pass program – $445,672 for FY 2011; $488,054 for FY 2012; and $540,060 for FY 2013.
In the past, the AATA has adjusted the charge to match actual ridership – which means that the amount of the DDA grants would likely need to increase as well, if that policy continued. However, a financial crunch at the DDA led the AATA to modify the amount it charges for rides taken under the go!pass program. At its Aug. 24, 2011 meeting, the AATA board voted to set the charges at the same amount for which the DDA had provided grants.
Figure 5 shows that the number of rides taken with the go!pass has increased steadily since 2004. That’s partly due to the steadily increasing number of go!passes in circulation. From FY 2010 to FY 2011, the number of passes sold jumped about 10% – from 6,537 to 7,226.
Ridership was up 23% in FY 2011 compared to FY 2010. It’s conceivable that some of the increase could be attributable to a change in the way go!pass ridership data is collected. It’s now collected with swipeable cards that pass holders run through the fare box, instead of depending on a driver’s manual button press. That change started on Nov. 1, 2010.
On the theory that fewer undercounting errors might be associated with a swipeable card system, some increase in the number of rides might be expected due purely to the change in data collection. However, in FY 2008, the program also had a ridership increase that outpaced the increase in passes sold – a 20% increase in ridership with a 5% increase in go!pass circulation. There was no change in data collection method at that time. In addition, there does not seem to be a similar bump in MRide ridership associated with the same change in data collection method, implemented in 2009.
Through the first three months of FY 2012, ridership on the go!pass program is tracking fairly close to FY 2011 [see Figure 6].
Ann Arbor Amtrak Ridership
Ann Arbor is one of the stations on Amtrak’s Wolverine Line, which runs from Pontiac through Detroit to Chicago. Amtrak ridership data is provided online by the Michigan Dept. of Transportation. Service is three times a day in each direction, for a total of six train stops a day. The schedule, westbound and eastbound is: 7:48 a.m. WB, 12:29 p.m. WB, 1:04 p.m. EB, 5:45 p.m. EB, 7:17 p.m. WB, 11:32 p.m. EB.
In the early part of the 2000s, ridership through the Ann Arbor station climbed steadily to reach 140,000 riders in 2006. [That counts passengers either getting on or getting off the train in Ann Arbor.] Since then, ridership has remained in the range of 140,000-145,000 except for 2009, when there was a clear dip – to about 126,000. That off year could be explained by the economic downturn in the fall of 2008, and by the the fact that average Ann Arbor area gas prices fell from over $4 per gallon in July 2008 to under $2 per gallon by January 2009 [see Figure 7].
Ann Arbor’s Amtrak ridership started off 2011 on a record-setting pace through April, which continued a bit less dramatically through May and June. By July, however, ridership numbers fell below the 2011 figures for every month through the end of 2011. That could be explained in part by decreases in the quality of on-time performance associated with speed restrictions placed on the track by its owner Norfolk-Southern in June 2011. The speed restrictions stem from the need to upgrade the track. Rather than undertake the track work necessary to allow for regular speeds, Norfolk-Southern elected to impose the speed limits. [As an example, the 5:45 p.m. scheduled arrival on Jan. 24, 2012 was 68 minutes late.] And in May 2011, the Detroit News published a column extolling the virtues of the car trip between Detroit and Chicago.
In October 2011, MDOT struck a deal with Norfolk-Southern to purchase the 135 miles of track between Kalamazoo and Dearborn. Track improvements, funded by federal stimulus money, are expected to allow the speed restrictions to be lifted.
The Chronicle could not survive without regular voluntary subscriptions to support our coverage of local government and civic affairs. Click this link for details: Subscribe to The Chronicle. And if you’re already supporting us, please encourage your friends, neighbors and colleagues to help support The Chronicle, too!


In my opinion, the chief limiter on my willingness to take the train to Chicago vs. driving is the unpredictability of the train.
The train takes 4-8 hours (unpredictable), is not cheap, but allows me to work.
The car takes 4 hours (usually, with rare exceptions), is not cheap, but does not allow me to work.
Even if the actual train speed is not improved (and it should go up some), changing the reliability from 4-8 hours to usually 4 hours will create an entirely different dynamic and is likely to result in a real spike in usage.
Of course, all my opinion and only time will tell.
I’m happy about the money our state got to fix the Detroit-Chicago rail line. It should make the trip more predictable soon by improving the track.
I used to be a rail commuter (over an hour each way, So. California). We had many adventures, including washed-out bridges, people on the tracks (a dead body really, really slows you down), people injured trying to run through crossings, engine trouble. But it was still better than driving. (Though not cheap, it consumed about 1/4 of my salary.)
If the train is being pushed out of the station by a locomotive at the rear, isn’t it “pushing away” rather than “pulling away”?
There are locomotives at both ends, though I’m not certain which one(s) are doing the work.
I’m curious how the rise of Megabus (sounds like a Godzilla film, doesn’t it?), which caters heavily to students, has affected Ann Arbor Amtrak ridership. It’s interesting to note that the sharp increase in ridership beginning in ’02 leveled off after 2006, the year the Megabus Detroit-Chicago route began, but correlation doesn’t necessarily mean causation. As Eric and Vivienne suggest, the upcoming improvements will increase the train’s relative appeal.
On further review of Wikipedia, the Ann Arbor Megabus stop was added in April 2007, not 2006.
There’s some crazy station-to-station and year-to-year variability in the Amtrak stats. For example, New Buffalo’s traffic grew 771% over the 2001-2011 period, and Royal Oak 307%, while Battle Creek only 12%. (Looking at any of those stations on 1999-2009 or 2000-2010 gives very different numbers.)
Applying some smoothing to the data, and comparing the “1999-2001 annual average” to the “2009-2011 annual average”, I’m getting Michigan-systemwide growth in ridership of 57%. Ann Arbor is right about there, at 51%. For some reason, the Oakland County stops on Wolverine are seeing big growth in that decade: Pontiac +92%, Birmingham +144%, Royal Oak +262%. (Though the three of those together have only half as many riders as Ann Arbor.) The west side, not so much growth: Jackson +9%, Battle Creek +2%, Niles -16% — Kalamazoo posts +48% (their train station was rebuilt in 2006 as a multimodal transit center, which probably helped its appeal — New Buffalo’s rebuilt and relocated station probably also helped their 477% increase in the smoothed data.)
MDOTs rail stats site doesn’t give trip-pairs, so we can’t easily see where people are going from any given station, but since Chicago accounts for 43% of the boardings/alightings in the entire Michigan system, we can assume most trips are to/from Chicago. I’ll speculate that Ann Arbor & Oakland County’s relatively higher growth is because gas prices (and airline annoyances) are a bigger motive for seeking alternatives from Royal Oak to Chicago than from Niles to Chicago, especially as the single biggest source of delays in the system is on the south side of Chicago — 2-3 hours of delay on a 90-minute trip is a much bigger problem than on a 5 hour trip.
Chicago’s “Englewood Flyover” project, started this past fall, should clear up much of that delay for the entire Michigan system — if my guess above is correct, we’d then see more ridership growth in the west michigan Wolverine stops. Michigan’s HSR work speeding up the line east of Kalamazoo will be a bonus on top of that. (If you really wanted to dig in, you could use Amtrak’s “on-time performance” stats to get better resolution on the delays, but both the south-side-of-Chicago and the Kzoo-Dearborn segments are owned by Norfolk-Southern, with track ownership the variable that Amtrak breaks down their stats by, so you’d have to do some work to disambiguate (comparing the Pere Marquette, which uses the Chicago NS track but not Kzoo-Dearborn?), which is more work than a Saturday morning comment merits…)