Editor’s note: The Ann Arbor city council is currently contemplating a major decision on adopting the legal framework by which its local transit authority could transition to a countywide system of governance – or at least one that is geographically bigger than the city of Ann Arbor. The decision on ratifying a four-party agreement – between the city of Ann Arbor, the city of Ypsilanti, the Ann Arbor Transportation Authority and Washtenaw County – was postponed for the second time at the council’s Monday, Jan. 23 meeting. The council meets next on Feb. 6.

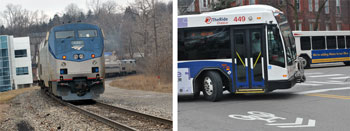
Amtrak train pulling away (despite appearances) from the Ann Arbor station on Jan. 25, 2012. Later that same day, Ann Arbor Transportation Authority buses converging on downtown Ann Arbor's Blake Transit Center. (Photos by the writer.)
The Chronicle is taking the pause between council meetings as an opportunity to offer readers a look at Ann Arbor’s current bus system ridership numbers over the last several years.
Part of a 30-year transit vision developed by the AATA includes the relocation of the Amtrak station – from Depot Street to a spot in the city’s Fuller Park. The proposed city/University of Michigan collaboration on the Fuller Road Station includes a large parking structure for the UM medical complex as its first phase. So we’re also taking a look at current ridership data on the Amtrak line through Ann Arbor.
Ann Arbor’s regular fixed route bus system provided 5.95 million rides for fiscal year 2011, which ended Sept. 30, 2011. That’s slightly better than the previous year, but was slightly off the record high year of 6.02 million rides delivered in FY 2009. The first three months of the 2012 fiscal year – October, November and December 2011 – show slight increases over the monthly numbers for FY 2011.
Of those 5.95 million rides provided by AATA in FY 2011, 2.43 million of them (41%) were provided through the University of Michigan MRide program – which allows faculty, students and staff of the university to board AATA buses without paying a fare. The cost for the service is paid by UM to the AATA. It was a record-setting year for the MRide program.
Also making up a portion of those 5.95 million rides were trips taken by holders of the getDowntown go!pass program, which allows downtown Ann Arbor employers to provide free bus passes for their employees for a nominal cost – the cost of the rides is funded through a grant from the Ann Arbor Downtown Development Authority.
In FY 2011, 634,000 rides were provided under the go!pass program – a 23% increase over FY 2010, adding to the trend of monotonically increasing numbers of go!pass rides over the last decade. The first three months of FY 2012 don’t show the same kind of double-digit increases for go!pass use as FY 2011 – they’re tracking roughly the same as last year.
The number of riders getting on and off the Amtrak trains that passed through Ann Arbor during the 2011 calendar year was 141,522. That figure tracked close to the same level of activity the station has seen since 2006 – from 140,000 to 145,000 riders. Through May 2011, Amtrak was on pace to eclipse the record number of riders in 2010 (145,040). But starting in July 2011, ridership was lower in every month (compared to 2010) through the end of the year.
Charts and graphs by The Chronicle – as well as more detailed breakdowns – are provided after the break. [Full Story]


