Column: Mapping Ann Arbor’s 2012 Elections
With the 2012 general elections well behind us, it’s time for politicians to put on their very serious faces and make very serious pronouncements like, “The voters have spoken.”
I prefer to make a funny face and ask: How is a judicial candidate like the city park system? Or for a question that sounds less like the set-up to a punch line: What’s the deal with downtown Ann Arbor and its connection to the art millage and the library bond proposal?
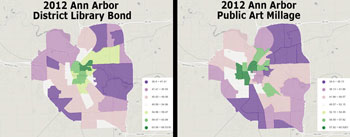
Voting results from two Nov. 6, 2012 proposals on the Ann Arbor ballot: The Ann Arbor District Library bond proposal and the public art millage. Maps do not include the portion of the library district outside the city boundary. Maps show only in-person votes, not including absentee voters. Shades of green through white indicate a majority voting yes. Shades of lavender through purple indicate a majority voting no. (Maps by The Chronicle.)
Of course, politicians are at least partly right when they say that the voters have spoken. But what did the voters actually say? It’s easy to make true statements about voter sentiment – if you stick to the text of the ballot.
For example, in the non-incumbent race for judge of the 22nd Circuit Court, more voters preferred to have Carol Kuhnke decide future Washtenaw County court cases than to have Jim Fink decide them. You can tell that just from the ballot and from the results. But it’s possible to make a stronger claim: More voters preferred the kind of person Kuhnke is – a candidate endorsed by the city of Ann Arbor Democratic Party. And to support that claim, we’d need to look at other results, like those from the presidential election.
Or by way of another example, the election results indicate that a majority of Ann Arbor voters said they do not want the city to levy an 0.1 mill tax to pay for art in public places. That’s all you can tell from the ballot question and the results. To make stronger claims – related, for example, to what (if anything) voters were trying to say about the existing Percent for Art program – you’d need to find some other way to explore the content of voters’ minds.
The same goes for the Ann Arbor District Library bond proposal and the parks maintenance and capital improvements millage renewal. “Do not tax us to make the bond payments for a new downtown library building, but please continue to tax us to pay for city park needs.” That’s all voters said. They didn’t say anything about their favorite books, or which city park is the best. (By the way, it’s West Park, located in Ward 5, which is indisputably the highest-numbered ward in the city.)
Yet we’d like to divine something more from the results than just the results.
This column, which is heavy on impressionistic conclusions based on maps, and light on rigorous statistical analysis, begins with mapped illustrations of some basics. For example, mostly Democrats live in the eastern portion of Washtenaw County. And in Ann Arbor, Wards 2 and 4 are the strongest city wards for Republicans – even though those wards also lean Democratic. That’s still true 20 years after Ann Arbor’s ward boundaries were drawn to achieve that effect.
The column concludes by illustrating a possible geographic connection between the failed public art millage and the failed downtown library bond proposal – namely, downtown Ann Arbor.
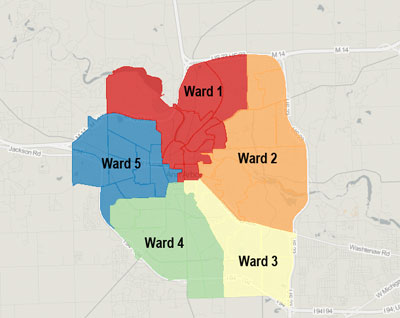
Ann Arbor City Ward Boundaries
The ward boundaries in the city of Ann Arbor underwent their last substantial revision in the early 1990s. The goal of the redistricting was to establish three heavily Democratic wards (1, 3 and 5), leaving two Republican-leaning wards (2 and 4). Comparing the ward boundaries in Map 1 and the results of the presidential race in Map 2, the ward-wise distribution of Democrats and Republicans has remained fairly stable. Except in the northwest precincts of Ward 4 – where the Ward 5 Democratic strength bleeds down into Ward 4 – the ward boundaries are reflected clearly in the presidential results.
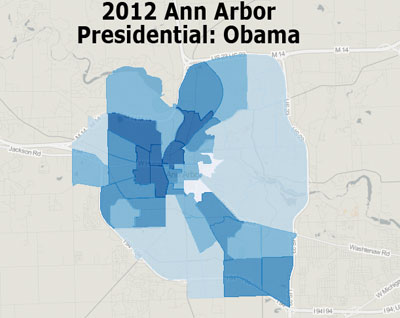
Map 2: Ann Arbor 2012 presidential election results (in-person voting only.) Darker blue reflects greater strength for Democrat Barack Obama.
Judges, Dems, Parks
Judicial races are non-partisan. But in the non-incumbent race between Carol Kuhnke and Jim Fink, the local Democratic Party endorsed Kuhnke. And Fink himself, during a candidate forum hosted by the Democratic Party, acknowledged that if it were a partisan legislative race, ”you would not even think about voting for me.” So it was not a secret that Kuhnke was “the Democrat” and Fink “the Republican” in the race. Fink’s pitch to Democrats as voters was that he would follow the law and as a judge set aside his personal views. And in fact, several high-profile Democrats supported his campaign.
In Map 3, the results within the city of Ann Arbor show that support for Kuhnke shows a vaguely similar pattern to the presidential results. But it was not by any means an exact mirroring of the pattern of support received by the Democratic presidential candidate, Barack Obama. In fact, the geographic distribution of Kuhnke’s support within the city of Ann Arbor seems to resemble more closely support for the parks millage (Map 4) than it does support for Obama.
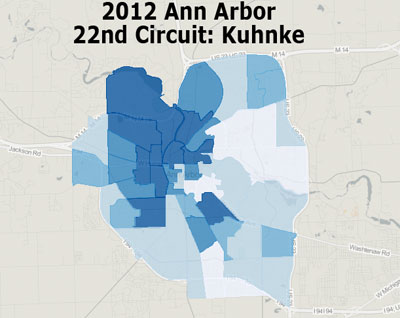
Map 3: Nov. 6, 2012 Ann Arbor city results for 22nd Circuit Court non-incumbent judicial race (in-person voting results only). Darker blue areas reflect stronger support for Carol Kuhnke, who defeated Jim Fink.
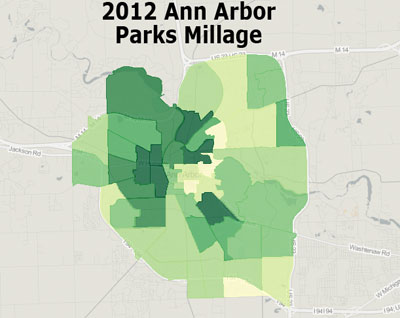
Map 4: Nov. 6, 2012 Ann Arbor city results for parks maintenance & capital improvements millage renewal (in-person voting results only). Darker green areas indicate greater support for the parks millage.
Countywide Judicial Race
Countywide, the race between Kuhnke and Fink (Map 6) also showed a roughly similar pattern to the presidential race (Map 5), but it was not by any stretch an exact mirroring.
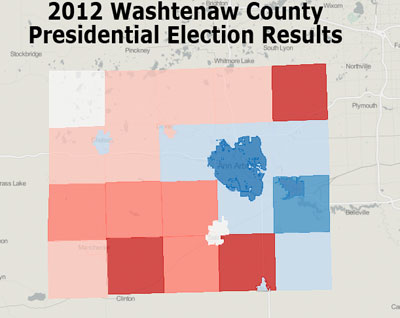
Map 5: Washtenaw County presidential results for the Nov. 6, 2012 election. Blue shades indicate a majority for Democrat Barack Obama. Red shades indicate support for Republican Mitt Romney.
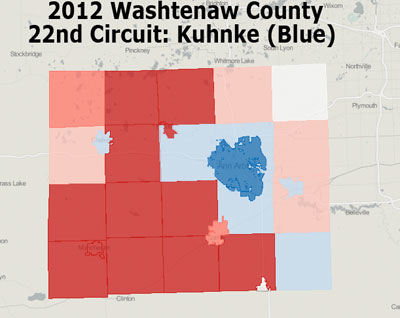
Map 6: Nov. 6, 2012 Washtenaw County results for 22nd Circuit Court non-incumbent judicial race. Blue shades indicate a majority for Carol Kuhnke. Red indicates support for Jim Fink.
So I think it’s fair to conclude that a substantial number of people voted for the kind of person that they perceived Kuhnke to be (a Democrat, with whatever associations that comes with) as contrasted with the kind of person they perceived Fink to be (a Republican, with whatever associations that comes with). But it’s also fair to conclude that many voters appealed to something other than the “party” in making their choice.
Art and the Library: Downtown Connection
I don’t think the geographic distribution of results in the presidential and judicial races is particularly surprising, even if they do make for pretty maps.
But the distribution of results within the city of Ann Arbor for the public art millage (Map 7) and the Ann Arbor District Library bond proposal (Map 8) reveals something interesting: One factor underlying voter sentiment on those two questions seems to be proximity to the downtown.
Both proposals drew their strongest support from areas near the geographic center of the city. Opposition was strongest in areas further away from the geographic center. For the library bond proposal, which would have funded construction of a new downtown library building, that’s not surprising. For the public art millage, it’s not as obvious that this should be the case.
One possible theory is that folks who live in or near downtown are just more “cosmopolitan” and “arty” and for that reason supported the millage. More plausible, I think, is the idea that greater support in the core areas really reflects less opposition – and that the opposition was based in part on the perception that the public art millage was all about only the downtown. That perception could be based on the fact that the two highest profile, most expensive, and most controversial pieces of public art produced by the city’s current Percent for Art program are located downtown: Herbert Dreiseitl’s fountain sculpture, and Ed Carpenter’s interior piece, both at the new Justice Center. [Carpenter's hanging sculpture has been commissioned, but not yet installed.]
Perhaps some of the votes against the public art millage might be seen as votes against a downtown-centric art program. The Ann Arbor public art commission has recently been working toward an approach that would be more geographically balanced – based on quadrants of the city. And a revision to the city’s public art ordinance that’s expected to be brought forward at the Nov. 19 city council meeting also has a geographic component. The proposed revision to the ordinance includes a requirement that councilmembers for the ward where a piece of art is proposed be notified of that proposal.
To the extent that the results on these two proposals reflect something about attitudes toward the downtown, the Ann Arbor Downtown Development Authority should take notice. Part of the logic behind enacting a downtown development authority – with its ability to “capture” taxes of other jurisdictions – is to pay for investments in the downtown area that wouldn’t otherwise be made.
Those investments wouldn’t otherwise be made, because the downtown would likely lose every single time, if the use of those taxes were put through the regular budgeting process. That’s because voters in the periphery (who’ll vote like any voters at least partly in a self-interested way) outnumber those in the core. The enactment of a downtown development authority is a mechanism for enforcing the discipline of making infrastructure investments in the downtown, without subjecting them to the relatively volatile annual city budgeting process.
I think one of the minor lessons of the 2012 general election in Ann Arbor is that the case for investments in the downtown is not obvious to many voters, and will need to be made on an ongoing basis.
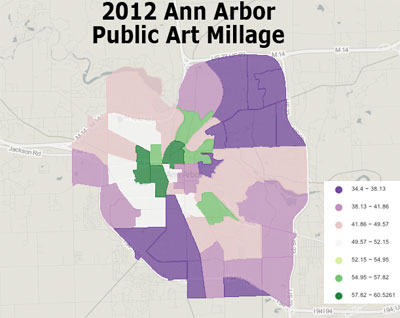
Map 7: Results of the Nov. 6, 2012 Ann Arbor public art millage. Maps show only in-person votes, not including absentee voters. Shades of green through white indicate a majority voting yes. Shades of lavender through purple indicate a majority voting no.
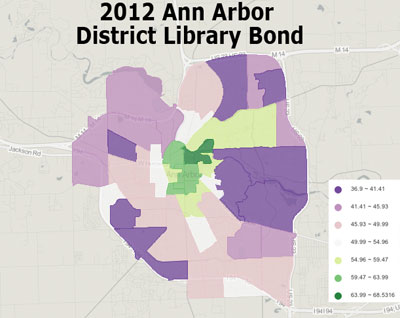
Map 8: Results for the Nov. 6, 2012 Ann Arbor District Library bond proposal (in-person voting results only). Results from townships outside Ann Arbor are not included. Shades of green through white indicate a majority voting yes. Shades of lavender through purple indicate a majority voting no.
Links to Maps
Links to the dynamic maps built by The Chronicle on geocommons.com:
- 2012 Ann Arbor city parks millage
- 2012 Ann Arbor public art millage
- 2012 Ann Arbor District Library bond proposal for a new downtown library
- 2012 Washtenaw County non-incumbent 22nd Circuit Court judicial race
- 2012 Washtenaw County U.S. presidential race results
- 2012 Ann Arbor city non-incumbent 22nd Circuit Court judicial race
- 2012 Ann Arbor city U.S. presidential race results
The Chronicle could not survive without regular voluntary subscriptions to support our coverage of civic affairs like elections. Click this link for details: Subscribe to The Chronicle. And if you’re already voting for us, please encourage your friends, neighbors and colleagues to help support The Chronicle, too!


Love the Chronicle’s maps!
I also always love the maps – only wish there was one for the Driskell-Ouimet race. I pretty much already know the numbers, but it’s still always better on a Chronicle map!
Great analysis. I don’t think the voters mumbled.
Thanks for the insightful piece. Lots here to ponder.
One comparison you didn’t make was between the Kuhnke/Fink and Connors/Woodyard races. Kuhnke had the local Democratic Party endorsement while neither candidate in the other race had the party’s endorsement (both were Democrats).
Thanks, David, for the maps. They make it quite clear why people outside the downtown area voted against the millage. They think of their closest branch library as “their library” and that the main branch downtown is not. I live near downtown and the main branch is “my library”. I voted for the library millage but I can understand why those farther away did not. Perhaps this feeling of not being part of the city should be addressed.
Dave, I thought you might make the case for the DDA taking on an Art in Downtown Places program.
I forget the DDA’s history with public art, aside from the 4th & Washington parking structure. Seems like it could be a more accepted approach. On the other hand, the Mary Thiefels mural at Allmendinger Park is very attractive. (I haven’t been through West Park to see how the installations there look. The only other non-downtown installation I’m remembering is the Sun Dragon at Fuller Park pool.)
Maybe downtown (DDA–retreat agenda item?) and parks (capital and maintenance millage) are alternatives to consider. A little late for the latter, of course. Maybe in 2017 when it’s up for renewal.
@5: “They think of their closest branch library as “their library” and that the main branch downtown is not.” (and) “Perhaps this feeling of not being part of the city should be addressed.”
As Dave wrote: “To make stronger claims – related, for example, to what (if anything) voters were trying to say about the existing Percent for Art program – you’d need to find some other way to explore the content of voters’ minds.”
Perhaps the best way is to simply ask. Speculating is perhaps the worst.
Re (5): Uh, not living downtown does not make us feel we are not “part of the city”. I think most of us understand the importance of the downtown library. (I can’t speak for all voters, only about the people I know.) Many of us voted against the bond precisely because we value the downtown library. “Protect Our Library” “Save Our Library” “Love Our Library”, not “Who needs it?”.
The analysis in which the downtown-centric emphasis was rejected rings true to me. But that might include rejecting the notion that downtown IS the city.
Re (6) The DDA was much involved with privately-donated and personally chosen art for the 4th & Washington structure, of which I am very fond. (Some of the artwork commemorates Reuben Bergman, and was supported by a donation from his family.) This was done under an earlier version of the art commission that did not use public money.
The DDA did an excellent job of saving the sculpture in Sculpture Park near Kerrytown when that area was renovated. They listened to local art and historic structure supporters and were sensitive to their points.
For sake of completeness, it should be noted that the boundaries of the library bond millage are beyond the city boundaries, and to get a complete view of what happened to it you’d have to account for the votes from Scio, Pittsfield, Lodi, and Ann Arbor Townships which were more negative than city wards if memory serves.
As @twentypoundcarp says on Twitter: [link]
Comin’ through the township to loot and pillage, runnin’ down ya swans, votin’ down ya millage.
Re: [8]
Already noted in the caption to Map 8. Outside Ann Arbor, the library bond proposal had 41.2% yes votes. Inside the city yes votes were 46.4%.
I’ve had great fun studying these maps. Thanks Dave. Regarding the library bond vote in the townships, there are three outliers (AV voters not included):
Scio Township, Precinct 2 where 75% voted for the library bond out of a total of 4 voters. This is a small area north of Jackson and west of Zeeb in AADL area.
Pittsfield Township, Precinct 2 where 51.78 voted for the library bond out of a total of 1149 voters. Mostly middle class single-family homes in the area bounded by US 23, Washtenaw, Golfside, and Packard.
Pittsfield Township, Precinct 4 where 57.08 voted for the library bond out of a total of 1109 voters. Many apartment complexes, including Glencoe Hills, are in the area bounded by US 23, Washtenaw, Golfside, and Clark.
Does anyone have an explanation for the positive vote in Pittsfield, Precinct 2?
I think I’ve figured out why the vote was higher in favor of the Art in Public Places millage and the Library bond in the central city than elsewhere.
In the central city there are far more renters than elsewhere. Renters don’t pay property tax directly, while property owners do. So when the renters went to the polls they saw only the benefits (art and a new library). They didn’t see the costs as applying to them. So they voted more heavily in favor of these two proposals.
My analysis is far from perfect. There are precincts that don’t fit. But the relationship between high renter percentage and high vote percentage is significant.
Re: [12] “In the central city there are far more renters than elsewhere.” In support of that contention, here’s another map: [.jpg of map showing owner-occupied housing distribution within Ann Arbor] from ESRI.
If you like election maps, check these out: [link]
Tom (#14), thanks for the link. It’s fascinating to see the population-scaled maps. Much better than the NBC ice rink!
Donna (#5), I agree. I tried to pop in to the Pittsfield branch library late morning yesterday, and could not find parking. This was during the middle of the day on a weekday! So although Steve (#7) does not approve of speculating, here goes: I believe that the Pittsfield branch was overflowing with neighborhood folks going to their neighborhood library, and had the proposal been to fund *their* library, they would have wholeheartedly supported it.
In my opinion, the AADL (unintentionally?) doomed the downtown library by investing in attractive full-service branches. Anyone who remembers the former Northeast branch, and compares it to the new Traverwood branch knows that NE was no destination, whereas Traverwood is a welcoming community resource. Despite what we’d like to believe, Ann Arbor may not be big enough to support the full-services branches as well as a downtown temple. The other important dynamics are the transition to digital information, and the suburbanization of Ann Arbor.
I think Mr. Cahill is correct, but I also think the U of M student (who ALSO do not pay property taxes) voting played a big part in close-to-downtown results as well. In fact, the Public Art Commission blatantly stated that they wanted this vote to take place while students were in town, which I found to be a telling indication of their convictions about the millage; if it is a good idea, they shouldn’t need to chase the votes of non-property tax paying “in town for the moment” residents.
Thanks, Dave, for another astute examination of local politics.
I’m no expert, but I did my own assessment, which includes votes Dave didn’t assess.
Live voters on 11/6, in the city of ann arbor, rejected the library bond 52% to 48%.
Absentee voters in the city of Ann Arbor, and all voters in the townships (as separate categories but with the same result) rejected the library bond 59% to 41%.
A significant percentage of voters did not vote on the library bond. I want to compare that “dropoff” to the art millage and park renewal but haven’t done so yet. Within the city of Ann Arbor, 12% of those who cast ballots did not vote on the library bond. District wide the dropoff was 11%. However even if all of those people had voted “yes”, the bond would have passed by only a few votes.
One of the keys to Bridget McCormack’s success running for the MI Supreme Court was her focus throughout the campaign, and especially on 11/6, on showing voters how to vote for her, and that checking the Dem. box would not do it.
I’m not surprised there was a dropoff for the library bond question. It was a really difficult vote for me, with what seemed like strong arguments on both sides. I wasn’t sure how I was going to vote until the day before, and I think I’m a fairly informed voter. In fact, I think this was a vote where the more you knew, the harder it was to decide, as opposed to people who just went on “libraries are good!” or “taxes are bad!”
Rukiddingme, I was including students as renters. Sorry I didn’t mention this explicitly in my original comment.